RBS 2013 Annual Report Download - page 394
Download and view the complete annual report
Please find page 394 of the 2013 RBS annual report below. You can navigate through the pages in the report by either clicking on the pages listed below, or by using the keyword search tool below to find specific information within the annual report.-
 1
1 -
2
-
3
-
4
-
5
-
6
-
7
-
8
-
9
-
10
-
11
-
12
-
13
-
14
-
15
-
16
-
17
-
18
-
19
-
20
-
21
-
22
-
23
-
24
-
25
-
26
-
27
-
28
-
29
-
30
-
31
-
32
-
33
-
34
-
35
-
36
-
37
-
38
-
39
-
40
-
41
-
42
-
43
-
44
-
45
-
46
-
47
-
48
-
49
-
50
-
51
-
52
-
53
-
54
-
55
-
56
-
57
-
58
-
59
-
60
-
61
-
62
-
63
-
64
-
65
-
66
-
67
-
68
-
69
-
70
-
71
-
72
-
73
-
74
-
75
-
76
-
77
-
78
-
79
-
80
-
81
-
82
-
83
-
84
-
85
-
86
-
87
-
88
-
89
-
90
-
91
-
92
-
93
-
94
-
95
-
96
-
97
-
98
-
99
-
100
-
101
-
102
-
103
-
104
-
105
-
106
-
107
-
108
-
109
-
110
-
111
-
112
-
113
-
114
-
115
-
116
-
117
-
118
-
119
-
120
-
121
-
122
-
123
-
124
-
125
-
126
-
127
-
128
-
129
-
130
-
131
-
132
-
133
-
134
-
135
-
136
-
137
-
138
-
139
-
140
-
141
-
142
-
143
-
144
-
145
-
146
-
147
-
148
-
149
-
150
-
151
-
152
-
153
-
154
-
155
-
156
-
157
-
158
-
159
-
160
-
161
-
162
-
163
-
164
-
165
-
166
-
167
-
168
-
169
-
170
-
171
-
172
-
173
-
174
-
175
-
176
-
177
-
178
-
179
-
180
-
181
-
182
-
183
-
184
-
185
-
186
-
187
-
188
-
189
-
190
-
191
-
192
-
193
-
194
-
195
-
196
-
197
-
198
-
199
-
200
-
201
-
202
-
203
-
204
-
205
-
206
-
207
-
208
-
209
-
210
-
211
-
212
-
213
-
214
-
215
-
216
-
217
-
218
-
219
-
220
-
221
-
222
-
223
-
224
-
225
-
226
-
227
-
228
-
229
-
230
-
231
-
232
-
233
-
234
-
235
-
236
-
237
-
238
-
239
-
240
-
241
-
242
-
243
-
244
-
245
-
246
-
247
-
248
-
249
-
250
-
251
-
252
-
253
-
254
-
255
-
256
-
257
-
258
-
259
-
260
-
261
-
262
-
263
-
264
-
265
-
266
-
267
-
268
-
269
-
270
-
271
-
272
-
273
-
274
-
275
-
276
-
277
-
278
-
279
-
280
-
281
-
282
-
283
-
284
-
285
-
286
-
287
-
288
-
289
-
290
-
291
-
292
-
293
-
294
-
295
-
296
-
297
-
298
-
299
-
300
-
301
-
302
-
303
-
304
-
305
-
306
-
307
-
308
-
309
-
310
-
311
-
312
-
313
-
314
-
315
-
316
-
317
-
318
-
319
-
320
-
321
-
322
-
323
-
324
-
325
-
326
-
327
-
328
-
329
-
330
-
331
-
332
-
333
-
334
-
335
-
336
-
337
-
338
-
339
-
340
-
341
-
342
-
343
-
344
-
345
-
346
-
347
-
348
-
349
-
350
-
351
-
352
-
353
-
354
-
355
-
356
-
357
-
358
-
359
-
360
-
361
-
362
-
363
-
364
-
365
-
366
-
367
-
368
-
369
-
370
-
371
-
372
-
373
-
374
-
375
-
376
-
377
-
378
-
379
-
380
-
381
-
382
-
383
-
 384
384 -
 385
385 -
 386
386 -
 387
387 -
 388
388 -
 389
389 -
 390
390 -
 391
391 -
 392
392 -
 393
393 -
 394
394 -
 395
395 -
 396
396 -
 397
397 -
 398
398 -
 399
399 -
 400
400 -
 401
401 -
 402
402 -
 403
403 -
 404
404 -
405
-
406
-
407
-
408
-
409
-
410
-
411
-
412
-
413
-
414
-
415
-
416
-
417
-
418
-
419
-
420
-
421
-
422
-
423
-
424
-
425
-
426
-
427
-
428
-
429
-
430
-
431
-
432
-
433
-
434
-
435
-
436
-
437
-
438
-
439
-
440
-
441
-
442
-
443
-
444
-
445
-
446
-
447
-
448
-
449
-
450
-
451
-
452
-
453
-
454
-
455
-
456
-
457
-
458
-
459
-
460
-
461
-
462
-
463
-
464
-
465
-
466
-
467
-
468
-
469
-
470
-
471
-
472
-
473
-
474
-
475
-
476
-
477
-
478
-
479
-
480
-
481
-
482
-
483
-
484
-
485
-
486
-
487
-
488
-
489
-
490
-
491
-
492
-
493
-
494
-
495
-
496
-
497
-
498
-
499
-
500
-
501
-
502
-
503
-
504
-
505
-
506
-
507
-
508
-
509
-
510
-
511
-
512
-
513
-
514
-
515
-
516
-
517
-
518
-
519
-
520
-
521
-
522
-
523
-
524
-
525
-
526
-
527
-
528
-
529
-
530
-
531
-
532
-
533
-
534
-
535
-
536
-
537
-
538
-
539
-
540
-
541
-
542
-
543
-
544
-
545
-
546
-
547
-
548
-
549
-
550
-
551
-
552
-
553
-
554
-
555
-
556
-
557
-
558
-
559
-
560
-
561
-
562
-
563
-
564
 |
 |

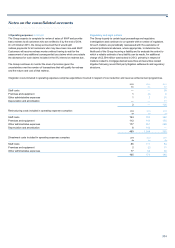
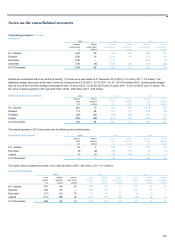
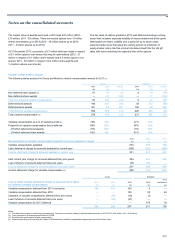
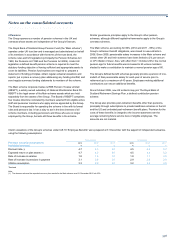
Notes on the consolidated accounts
392
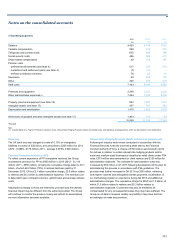
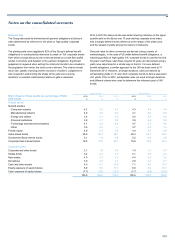
2 Non-interest income 2013 2012 2011
£m £m £m
Fees and commissions receivable
Payment services 1,432 1,368 1,498
Credit and debit card fees 1,078 1,088 1,093
Lending (credit facilities) 1,377 1,480 1,707
Brokerage 479 548 631
Trade finance 300 314 410
Investment management 450 471 525
Other 344 440 515
5,460 5,709 6,379
Fees and commissions payable
Banking (942) (834) (962)
Income from trading activities (1)
Foreign exchange 854 654 1,327
Interest rate 596 1,932 760
Credit 998 737 (308)
Changes in fair value of own debt and derivative liabilities attributable to own credit
- debt securities in issue 131 (1,473) 225
- derivative liabilities (96) (340) 68
Equities 209 164 606
Commodities and other (7) 1 23
2,685 1,675 2,701
Gain on redemption of own debt (2) 175 454 255
Other operating income
Operating lease and other rental income 484 876 1,307
Changes in the fair value of own debt designated as at fair value through profit or loss attributable to
own credit risk (3)
- debt securities in issue (49) (2,531) 1,259
- subordinated liabilities (106) (305) 362
Other changes in the fair value of financial assets and liabilities designated as at fair value through profit
or loss and related derivatives (26) 146 150
Changes in the fair value of investment properties (281) (153) (139)
Profit on sale of securities 830 1,146 829
Profit on sale of property, plant and equipment 44 34 22
Profit on sale of subsidiaries and associates 168 95 (30)
Dividend income 87 59 54
Share of profits of associated entities 320 29 26
Other income (4) (73) 139 135
1,398 (465) 3,975
Notes:
(1) The analysis of income from trading activities is based on how the business is organised and the underlying risks managed. Income from trading activities comprises gains and losses on financial
instruments held for trading, both realised and unrealised, interest income and dividends and the related funding costs. The types of instruments include:
- Foreign exchange: spot foreign exchange contracts, currency swaps and options, emerging markets and related hedges and funding.
- Interest rate: interest rate swaps, forward foreign exchange contracts, forward rate agreements, interest rate options, interest rate futures and related hedges and funding.
- Credit: asset-backed securities, corporate bonds, credit derivatives and related hedges and funding.
- Equities: equities, equity derivatives and related hedges and funding.
- Commodities: commodities, commodity contracts and related hedges and funding.
(2) In January 2013, the Group redeemed certain senior unsecured securities for cash resulting in losses of £51 million. In June 2013, the Group redeemed certain mortgage backed debt securities in
exchange for cash resulting in gains totalling £242 million. In July 2013, the Group redeemed certain unsecured subordinated debt securities resulting in a gain of £13 million. In December 2013, the
Group redeemed £987 million of senior unsecured debt resulting in a loss of £29 million. In March 2012 and September 2012, the Group redeemed certain notes resulting in net gains totalling £454
million being credited to profit or loss. In June 2011, the Group redeemed certain mortgage backed debt securities in exchange for cash, resulting in gains totalling £255 million being credited to profit
or loss.
(3) Measured as the change in fair value from movements in the year in the credit risk premium payable by the Group.
(4) Includes income from activities other than banking and insurance.