RBS 2013 Annual Report Download - page 506
Download and view the complete annual report
Please find page 506 of the 2013 RBS annual report below. You can navigate through the pages in the report by either clicking on the pages listed below, or by using the keyword search tool below to find specific information within the annual report.-
 1
1 -
2
-
3
-
4
-
5
-
6
-
7
-
8
-
9
-
10
-
11
-
12
-
13
-
14
-
15
-
16
-
17
-
18
-
19
-
20
-
21
-
22
-
23
-
24
-
25
-
26
-
27
-
28
-
29
-
30
-
31
-
32
-
33
-
34
-
35
-
36
-
37
-
38
-
39
-
40
-
41
-
42
-
43
-
44
-
45
-
46
-
47
-
48
-
49
-
50
-
51
-
52
-
53
-
54
-
55
-
56
-
57
-
58
-
59
-
60
-
61
-
62
-
63
-
64
-
65
-
66
-
67
-
68
-
69
-
70
-
71
-
72
-
73
-
74
-
75
-
76
-
77
-
78
-
79
-
80
-
81
-
82
-
83
-
84
-
85
-
86
-
87
-
88
-
89
-
90
-
91
-
92
-
93
-
94
-
95
-
96
-
97
-
98
-
99
-
100
-
101
-
102
-
103
-
104
-
105
-
106
-
107
-
108
-
109
-
110
-
111
-
112
-
113
-
114
-
115
-
116
-
117
-
118
-
119
-
120
-
121
-
122
-
123
-
124
-
125
-
126
-
127
-
128
-
129
-
130
-
131
-
132
-
133
-
134
-
135
-
136
-
137
-
138
-
139
-
140
-
141
-
142
-
143
-
144
-
145
-
146
-
147
-
148
-
149
-
150
-
151
-
152
-
153
-
154
-
155
-
156
-
157
-
158
-
159
-
160
-
161
-
162
-
163
-
164
-
165
-
166
-
167
-
168
-
169
-
170
-
171
-
172
-
173
-
174
-
175
-
176
-
177
-
178
-
179
-
180
-
181
-
182
-
183
-
184
-
185
-
186
-
187
-
188
-
189
-
190
-
191
-
192
-
193
-
194
-
195
-
196
-
197
-
198
-
199
-
200
-
201
-
202
-
203
-
204
-
205
-
206
-
207
-
208
-
209
-
210
-
211
-
212
-
213
-
214
-
215
-
216
-
217
-
218
-
219
-
220
-
221
-
222
-
223
-
224
-
225
-
226
-
227
-
228
-
229
-
230
-
231
-
232
-
233
-
234
-
235
-
236
-
237
-
238
-
239
-
240
-
241
-
242
-
243
-
244
-
245
-
246
-
247
-
248
-
249
-
250
-
251
-
252
-
253
-
254
-
255
-
256
-
257
-
258
-
259
-
260
-
261
-
262
-
263
-
264
-
265
-
266
-
267
-
268
-
269
-
270
-
271
-
272
-
273
-
274
-
275
-
276
-
277
-
278
-
279
-
280
-
281
-
282
-
283
-
284
-
285
-
286
-
287
-
288
-
289
-
290
-
291
-
292
-
293
-
294
-
295
-
296
-
297
-
298
-
299
-
300
-
301
-
302
-
303
-
304
-
305
-
306
-
307
-
308
-
309
-
310
-
311
-
312
-
313
-
314
-
315
-
316
-
317
-
318
-
319
-
320
-
321
-
322
-
323
-
324
-
325
-
326
-
327
-
328
-
329
-
330
-
331
-
332
-
333
-
334
-
335
-
336
-
337
-
338
-
339
-
340
-
341
-
342
-
343
-
344
-
345
-
346
-
347
-
348
-
349
-
350
-
351
-
352
-
353
-
354
-
355
-
356
-
357
-
358
-
359
-
360
-
361
-
362
-
363
-
364
-
365
-
366
-
367
-
368
-
369
-
370
-
371
-
372
-
373
-
374
-
375
-
376
-
377
-
378
-
379
-
380
-
381
-
382
-
383
-
384
-
385
-
386
-
387
-
388
-
389
-
390
-
391
-
392
-
393
-
394
-
395
-
396
-
397
-
398
-
399
-
400
-
401
-
402
-
403
-
404
-
405
-
406
-
407
-
408
-
409
-
410
-
411
-
412
-
413
-
414
-
415
-
416
-
417
-
418
-
419
-
420
-
421
-
422
-
423
-
424
-
425
-
426
-
427
-
428
-
429
-
430
-
431
-
432
-
433
-
434
-
435
-
436
-
437
-
438
-
439
-
440
-
441
-
442
-
443
-
444
-
445
-
446
-
447
-
448
-
449
-
450
-
451
-
452
-
453
-
454
-
455
-
456
-
457
-
458
-
459
-
460
-
461
-
462
-
463
-
464
-
465
-
466
-
467
-
468
-
469
-
470
-
471
-
472
-
473
-
474
-
475
-
476
-
477
-
478
-
479
-
480
-
481
-
482
-
483
-
484
-
485
-
486
-
487
-
488
-
489
-
490
-
491
-
492
-
493
-
494
-
495
-
 496
496 -
 497
497 -
 498
498 -
 499
499 -
 500
500 -
 501
501 -
 502
502 -
 503
503 -
 504
504 -
 505
505 -
 506
506 -
 507
507 -
 508
508 -
 509
509 -
 510
510 -
 511
511 -
 512
512 -
 513
513 -
 514
514 -
 515
515 -
 516
516 -
517
-
518
-
519
-
520
-
521
-
522
-
523
-
524
-
525
-
526
-
527
-
528
-
529
-
530
-
531
-
532
-
533
-
534
-
535
-
536
-
537
-
538
-
539
-
540
-
541
-
542
-
543
-
544
-
545
-
546
-
547
-
548
-
549
-
550
-
551
-
552
-
553
-
554
-
555
-
556
-
557
-
558
-
559
-
560
-
561
-
562
-
563
-
564
 |
 |

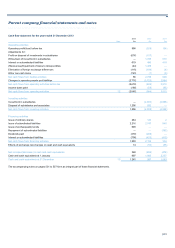
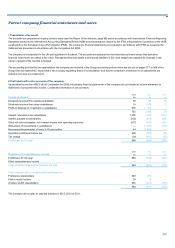
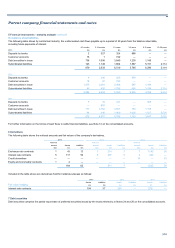
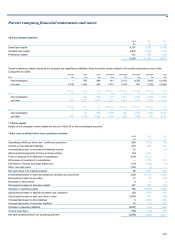
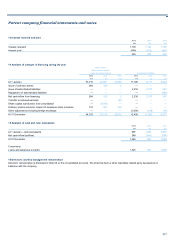
Parent company financial statements and notes
504
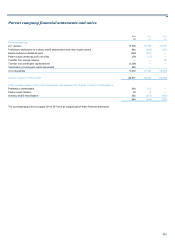
5 Financial instruments - maturity analysis continued
On balance sheet liabilities
The following table shows by contractual maturity, the undiscounted cash flows payable up to a period of 20 years from the balance sheet date,
including future payments of interest.
0-3 months 3-12 months 1-3 years 3-5 years 5-10 years 10-20 years
2013 £m £m £m £m £m £m
Deposits by banks 2 327 324 988 — —
Customer accounts 18 1 742 — — —
Debt securities in issue 736 1,056 3,649 1,230 1,145 —
Subordinated liabilities 123 1,149 1,804 1,567 5,151 2,114
879 2,533 6,519 3,785 6,296 2,114
2012
Deposits by banks 6 338 325 958 — —
Customer accounts 18 97 742 — — —
Debt securities in issue 1,975 3,663 2,406 567 1,194 —
Subordinated liabilities 85 826 1,796 680 3,158 2,314
2,084 4,924 5,269 2,205 4,352 2,314
2011
Deposits by banks 5 16 341 — 965 —
Customer accounts — 993 — — — —
Debt securities in issue 777 3,152 3,597 163 1,155 —
Subordinated liabilities 94 340 1,860 1,020 1,527 2,525
876 4,501 5,798 1,183 3,647 2,525
For further information on the timing of cash flows to settle financial liabilities, see Note 12 on the consolidated accounts.
6 Derivatives
The following table shows the notional amounts and fair values of the company's derivatives.
2013 2012 2011
Notional Notional Notional
amount Assets Liabilities amount Assets Liabilities amount Assets Liabilities
£bn £m £m £bn £m £m £bn £m £m
Exchange rate contracts 1 43 12 3 214 2 7 1,182 26
Interest rate contracts 5 117 50 6 297 5 4 320 —
Credit derivatives — — — — — — 10 — 53
Equity and commodity contracts 1 4 — — — — — — —
164 62 511 7 1,502 79
Included in the table above are derivatives held for hedging purposes as follows:
2013 2012 2011
Assets Liabilities Assets Liabilities Assets Liabilities
Fair value hedging £m £m £m £m £m £m
Interest rate contracts 104 37 291 — 279 —
7 Debt securities
Debt securities comprise the partial repurchase of preferred securities issued by the trusts referred to in Notes 24 and 26 on the consolidated accounts.