RBS 2013 Annual Report Download - page 337
Download and view the complete annual report
Please find page 337 of the 2013 RBS annual report below. You can navigate through the pages in the report by either clicking on the pages listed below, or by using the keyword search tool below to find specific information within the annual report.-
 1
1 -
2
-
3
-
4
-
5
-
6
-
7
-
8
-
9
-
10
-
11
-
12
-
13
-
14
-
15
-
16
-
17
-
18
-
19
-
20
-
21
-
22
-
23
-
24
-
25
-
26
-
27
-
28
-
29
-
30
-
31
-
32
-
33
-
34
-
35
-
36
-
37
-
38
-
39
-
40
-
41
-
42
-
43
-
44
-
45
-
46
-
47
-
48
-
49
-
50
-
51
-
52
-
53
-
54
-
55
-
56
-
57
-
58
-
59
-
60
-
61
-
62
-
63
-
64
-
65
-
66
-
67
-
68
-
69
-
70
-
71
-
72
-
73
-
74
-
75
-
76
-
77
-
78
-
79
-
80
-
81
-
82
-
83
-
84
-
85
-
86
-
87
-
88
-
89
-
90
-
91
-
92
-
93
-
94
-
95
-
96
-
97
-
98
-
99
-
100
-
101
-
102
-
103
-
104
-
105
-
106
-
107
-
108
-
109
-
110
-
111
-
112
-
113
-
114
-
115
-
116
-
117
-
118
-
119
-
120
-
121
-
122
-
123
-
124
-
125
-
126
-
127
-
128
-
129
-
130
-
131
-
132
-
133
-
134
-
135
-
136
-
137
-
138
-
139
-
140
-
141
-
142
-
143
-
144
-
145
-
146
-
147
-
148
-
149
-
150
-
151
-
152
-
153
-
154
-
155
-
156
-
157
-
158
-
159
-
160
-
161
-
162
-
163
-
164
-
165
-
166
-
167
-
168
-
169
-
170
-
171
-
172
-
173
-
174
-
175
-
176
-
177
-
178
-
179
-
180
-
181
-
182
-
183
-
184
-
185
-
186
-
187
-
188
-
189
-
190
-
191
-
192
-
193
-
194
-
195
-
196
-
197
-
198
-
199
-
200
-
201
-
202
-
203
-
204
-
205
-
206
-
207
-
208
-
209
-
210
-
211
-
212
-
213
-
214
-
215
-
216
-
217
-
218
-
219
-
220
-
221
-
222
-
223
-
224
-
225
-
226
-
227
-
228
-
229
-
230
-
231
-
232
-
233
-
234
-
235
-
236
-
237
-
238
-
239
-
240
-
241
-
242
-
243
-
244
-
245
-
246
-
247
-
248
-
249
-
250
-
251
-
252
-
253
-
254
-
255
-
256
-
257
-
258
-
259
-
260
-
261
-
262
-
263
-
264
-
265
-
266
-
267
-
268
-
269
-
270
-
271
-
272
-
273
-
274
-
275
-
276
-
277
-
278
-
279
-
280
-
281
-
282
-
283
-
284
-
285
-
286
-
287
-
288
-
289
-
290
-
291
-
292
-
293
-
294
-
295
-
296
-
297
-
298
-
299
-
300
-
301
-
302
-
303
-
304
-
305
-
306
-
307
-
308
-
309
-
310
-
311
-
312
-
313
-
314
-
315
-
316
-
317
-
318
-
319
-
320
-
321
-
322
-
323
-
324
-
325
-
326
-
 327
327 -
 328
328 -
 329
329 -
 330
330 -
 331
331 -
 332
332 -
 333
333 -
 334
334 -
 335
335 -
 336
336 -
 337
337 -
 338
338 -
 339
339 -
 340
340 -
 341
341 -
 342
342 -
 343
343 -
 344
344 -
 345
345 -
 346
346 -
 347
347 -
348
-
349
-
350
-
351
-
352
-
353
-
354
-
355
-
356
-
357
-
358
-
359
-
360
-
361
-
362
-
363
-
364
-
365
-
366
-
367
-
368
-
369
-
370
-
371
-
372
-
373
-
374
-
375
-
376
-
377
-
378
-
379
-
380
-
381
-
382
-
383
-
384
-
385
-
386
-
387
-
388
-
389
-
390
-
391
-
392
-
393
-
394
-
395
-
396
-
397
-
398
-
399
-
400
-
401
-
402
-
403
-
404
-
405
-
406
-
407
-
408
-
409
-
410
-
411
-
412
-
413
-
414
-
415
-
416
-
417
-
418
-
419
-
420
-
421
-
422
-
423
-
424
-
425
-
426
-
427
-
428
-
429
-
430
-
431
-
432
-
433
-
434
-
435
-
436
-
437
-
438
-
439
-
440
-
441
-
442
-
443
-
444
-
445
-
446
-
447
-
448
-
449
-
450
-
451
-
452
-
453
-
454
-
455
-
456
-
457
-
458
-
459
-
460
-
461
-
462
-
463
-
464
-
465
-
466
-
467
-
468
-
469
-
470
-
471
-
472
-
473
-
474
-
475
-
476
-
477
-
478
-
479
-
480
-
481
-
482
-
483
-
484
-
485
-
486
-
487
-
488
-
489
-
490
-
491
-
492
-
493
-
494
-
495
-
496
-
497
-
498
-
499
-
500
-
501
-
502
-
503
-
504
-
505
-
506
-
507
-
508
-
509
-
510
-
511
-
512
-
513
-
514
-
515
-
516
-
517
-
518
-
519
-
520
-
521
-
522
-
523
-
524
-
525
-
526
-
527
-
528
-
529
-
530
-
531
-
532
-
533
-
534
-
535
-
536
-
537
-
538
-
539
-
540
-
541
-
542
-
543
-
544
-
545
-
546
-
547
-
548
-
549
-
550
-
551
-
552
-
553
-
554
-
555
-
556
-
557
-
558
-
559
-
560
-
561
-
562
-
563
-
564
 |
 |

Business review Risk and balance sheet management
335
The Group uses both approaches to quantify its interest rate risk: VaR as
its value-based approach and sensitivity of net interest income (NII) as its
earnings-based approach.
These two approaches provide different yet complementary views of the
impact of interest rate risk on the balance sheet at a point in time. The
scenarios employed in the NII sensitivity approach incorporate business
assumptions and simulated modifications in customer behaviour as
interest rates change. In contrast, the VaR approach assumes static
underlying positions and therefore does not provide a dynamic
measurement of interest rate risk. In addition, while the NII sensitivity
calculations are measured to a 12-month horizon and thus provide a
shorter-term view of the risks on the balance sheet, the VaR approach
can identify risks not captured in the sensitivity analysis, in particular the
impact of duration and repricing risk on earnings beyond 12 months.
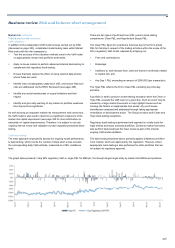
Value-at-risk
The Group’s standard VaR metrics - which assume a time horizon of one
trading day and a confidence level of 99% - are based on interest rate
repricing gaps at the reporting date. Daily rate moves are modelled using
observations over the last 500 business days. These incorporate
customer products plus associated funding and hedging transactions as
well as non-financial assets and liabilities such as property, plant and
equipment, capital and reserves. Behavioural assumptions are applied as
appropriate.
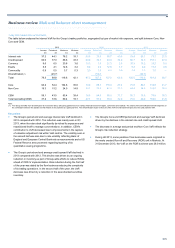
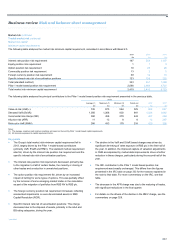
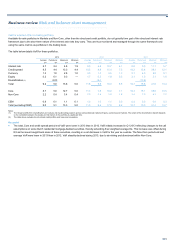
The table below shows the NTIRR VaR for the Group’s retail and
commercial banking activities at a 99% confidence level together with a
currency analysis of period end VaR.
Average Period end Maximum Minimum
£m £m £m £m
2013 45 51 57 30
2012 46 21 65 20
2011 63 51 80 44
2013 2012 2011
£m £m £m
Euro 4 19 26
Sterling 19 17 57
US dollar 44 15 61
Other 2 4 5
Key points
• Period end interest rate VaR was higher at 31 December 2013 than
at 31 December 2012. Average VaR was relatively unchanged.
• The overall year-on-year increase in VaR mainly reflected an
increase in the duration of the Group’s balance sheet - that is,
greater economic exposure to longer-term interest rates - as
described in more detail below.
• Euro VaR fell, reflecting action taken to reduce the Group’s
exposure to euro-denominated fixed-rate assets.
• US dollar VaR rose, reflecting action taken by US Retail &
Commercial to reduce earnings sensitivity to movements in short
term dollar interest rates.
• These movements remained well within the Group’s approved
market risk appetite.
Sensitivity of net interest income*
To analyse earnings sensitivities, forecasts are generated using implied
forward rates, projected new business volumes, mix and pricing
generated using business assumptions. Based on the balance sheet at
the most recent month end, two NII forecasts are calculated each month:
(i) a forecast for the current full year, which incorporates actuals on a
monthly basis as the year progresses; and (ii) a base-case 12 month
rolling forecast.
In addition, the 12 month rolling forecast is re-run using alternative rates
under various scenarios, incorporating changes in customer behaviour
and business assumptions as appropriate. Variances between these
scenarios are analysed to identify key drivers. These forecasts and
sensitivities form part of the information used by senior management to
manage the Group's NII targets.
This sensitivity analysis also incorporates assumptions relating to
optionality risk.