RBS 2013 Annual Report Download - page 511
Download and view the complete annual report
Please find page 511 of the 2013 RBS annual report below. You can navigate through the pages in the report by either clicking on the pages listed below, or by using the keyword search tool below to find specific information within the annual report.-
 1
1 -
2
-
3
-
4
-
5
-
6
-
7
-
8
-
9
-
10
-
11
-
12
-
13
-
14
-
15
-
16
-
17
-
18
-
19
-
20
-
21
-
22
-
23
-
24
-
25
-
26
-
27
-
28
-
29
-
30
-
31
-
32
-
33
-
34
-
35
-
36
-
37
-
38
-
39
-
40
-
41
-
42
-
43
-
44
-
45
-
46
-
47
-
48
-
49
-
50
-
51
-
52
-
53
-
54
-
55
-
56
-
57
-
58
-
59
-
60
-
61
-
62
-
63
-
64
-
65
-
66
-
67
-
68
-
69
-
70
-
71
-
72
-
73
-
74
-
75
-
76
-
77
-
78
-
79
-
80
-
81
-
82
-
83
-
84
-
85
-
86
-
87
-
88
-
89
-
90
-
91
-
92
-
93
-
94
-
95
-
96
-
97
-
98
-
99
-
100
-
101
-
102
-
103
-
104
-
105
-
106
-
107
-
108
-
109
-
110
-
111
-
112
-
113
-
114
-
115
-
116
-
117
-
118
-
119
-
120
-
121
-
122
-
123
-
124
-
125
-
126
-
127
-
128
-
129
-
130
-
131
-
132
-
133
-
134
-
135
-
136
-
137
-
138
-
139
-
140
-
141
-
142
-
143
-
144
-
145
-
146
-
147
-
148
-
149
-
150
-
151
-
152
-
153
-
154
-
155
-
156
-
157
-
158
-
159
-
160
-
161
-
162
-
163
-
164
-
165
-
166
-
167
-
168
-
169
-
170
-
171
-
172
-
173
-
174
-
175
-
176
-
177
-
178
-
179
-
180
-
181
-
182
-
183
-
184
-
185
-
186
-
187
-
188
-
189
-
190
-
191
-
192
-
193
-
194
-
195
-
196
-
197
-
198
-
199
-
200
-
201
-
202
-
203
-
204
-
205
-
206
-
207
-
208
-
209
-
210
-
211
-
212
-
213
-
214
-
215
-
216
-
217
-
218
-
219
-
220
-
221
-
222
-
223
-
224
-
225
-
226
-
227
-
228
-
229
-
230
-
231
-
232
-
233
-
234
-
235
-
236
-
237
-
238
-
239
-
240
-
241
-
242
-
243
-
244
-
245
-
246
-
247
-
248
-
249
-
250
-
251
-
252
-
253
-
254
-
255
-
256
-
257
-
258
-
259
-
260
-
261
-
262
-
263
-
264
-
265
-
266
-
267
-
268
-
269
-
270
-
271
-
272
-
273
-
274
-
275
-
276
-
277
-
278
-
279
-
280
-
281
-
282
-
283
-
284
-
285
-
286
-
287
-
288
-
289
-
290
-
291
-
292
-
293
-
294
-
295
-
296
-
297
-
298
-
299
-
300
-
301
-
302
-
303
-
304
-
305
-
306
-
307
-
308
-
309
-
310
-
311
-
312
-
313
-
314
-
315
-
316
-
317
-
318
-
319
-
320
-
321
-
322
-
323
-
324
-
325
-
326
-
327
-
328
-
329
-
330
-
331
-
332
-
333
-
334
-
335
-
336
-
337
-
338
-
339
-
340
-
341
-
342
-
343
-
344
-
345
-
346
-
347
-
348
-
349
-
350
-
351
-
352
-
353
-
354
-
355
-
356
-
357
-
358
-
359
-
360
-
361
-
362
-
363
-
364
-
365
-
366
-
367
-
368
-
369
-
370
-
371
-
372
-
373
-
374
-
375
-
376
-
377
-
378
-
379
-
380
-
381
-
382
-
383
-
384
-
385
-
386
-
387
-
388
-
389
-
390
-
391
-
392
-
393
-
394
-
395
-
396
-
397
-
398
-
399
-
400
-
401
-
402
-
403
-
404
-
405
-
406
-
407
-
408
-
409
-
410
-
411
-
412
-
413
-
414
-
415
-
416
-
417
-
418
-
419
-
420
-
421
-
422
-
423
-
424
-
425
-
426
-
427
-
428
-
429
-
430
-
431
-
432
-
433
-
434
-
435
-
436
-
437
-
438
-
439
-
440
-
441
-
442
-
443
-
444
-
445
-
446
-
447
-
448
-
449
-
450
-
451
-
452
-
453
-
454
-
455
-
456
-
457
-
458
-
459
-
460
-
461
-
462
-
463
-
464
-
465
-
466
-
467
-
468
-
469
-
470
-
471
-
472
-
473
-
474
-
475
-
476
-
477
-
478
-
479
-
480
-
481
-
482
-
483
-
484
-
485
-
486
-
487
-
488
-
489
-
490
-
491
-
492
-
493
-
494
-
495
-
496
-
497
-
498
-
499
-
500
-
 501
501 -
 502
502 -
 503
503 -
 504
504 -
 505
505 -
 506
506 -
 507
507 -
 508
508 -
 509
509 -
 510
510 -
 511
511 -
 512
512 -
 513
513 -
 514
514 -
 515
515 -
 516
516 -
 517
517 -
 518
518 -
 519
519 -
 520
520 -
 521
521 -
522
-
523
-
524
-
525
-
526
-
527
-
528
-
529
-
530
-
531
-
532
-
533
-
534
-
535
-
536
-
537
-
538
-
539
-
540
-
541
-
542
-
543
-
544
-
545
-
546
-
547
-
548
-
549
-
550
-
551
-
552
-
553
-
554
-
555
-
556
-
557
-
558
-
559
-
560
-
561
-
562
-
563
-
564
 |
 |

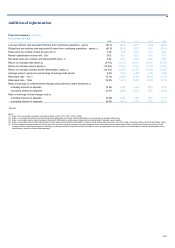
Additional information
509
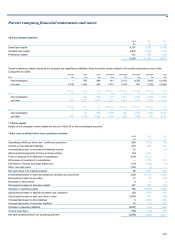
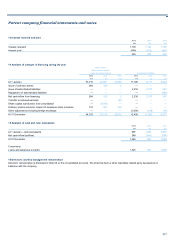
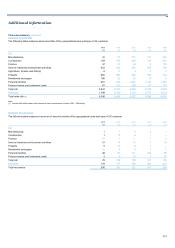
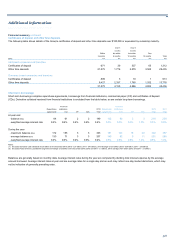
Financial summary
The Group's financial statements are prepared in accordance with IFRS. Selected data under IFRS for each of the last five years are presented below.
2013 2012* 2011* 2010* 2009*
Summary consolidated income statement £m £m £m £m £m
Net interest income 10,981 11,402 12,303 13,782 12,928
Non-interest income (1,2,3) 8,776 6,539 12,348 12,840 14,650
Total income 19,757 17,941 24,651 26,622 27,578
Operating expenses (4,5,6,7,8,9) (19,568) (17,939) (17,340) (17,600) (16,652)
Profit before insurance net claims and impairment losses 189 2 7,311 9,022 10,926
Insurance net claims — — — (85) (134)
Impairment losses (10) (8,432) (5,279) (8,707) (9,235) (13,891)
Operating loss before tax (8,243) (5,277) (1,396) (298) (3,099)
Tax (charge)/credit (382) (441) (1,075) (664) 515
Loss from continuing operations (8,625) (5,718) (2,471) (962) (2,584)
Profit/(loss) from discontinued operations, net of tax 148 (172) 348 (809) 248
Loss for the year (8,477) (5,890) (2,123) (1,771) (2,336)
Loss attributable to:
Non-controlling interests 120 (136) 28 (675) 358
Preference shareholders 349 273 — 105 878
Paid-in equity holders 49 28 — 29 96
Ordinary and B shareholders (8,995) (6,055) (2,151) (1,230) (3,668)
*Restated
Notes:
(1) Includes profit on strategic disposals of £161 million (2012 - £113 million profit; 2011 - £25 million loss; 2010 - £171 million profit; 2009 - £82 million loss).
(2) Includes gain on redemption of own debt of £175 million (2012 - £454 million; 2011 - £255 million; 2010 - £553 million; 2009 - £3,790 million).
(3) Includes own credit adjustments of £120 million loss (2012 - £4,649 million loss; 2011 - £1,914 million gain; 2010 - £242 million gain; 2009 - £97 million loss).
(4) Includes Payment Protection Insurance costs of £900 million (2012 - £1,110 million; 2011 - £850 million), Interest Rate Hedging Products redress and related costs of £550 million (2012 - £700
million) and regulatory and legal actions of £2,394 million (2012 - £381 million).
(5) Includes integration and restructuring costs of £656 million (2012 - £1,415 million; 2011 - £1,021 million; 2010 - £1,012 million; 2009 - £1,276 million).
(6) Includes amortisation of purchased intangible assets of £153 million (2012 - £177 million; 2011 - £222 million; 2010 - £369 million; 2009 - £272 million).
(7) Includes write-down of goodwill of £1,059 million (2012 - £18 million; 2011 - £80 million; 2010 - £1 million; 2009 - £296 million).
(8) Includes gains on pensions curtailment of £2,148 million in 2009.
(9) Includes write-down of other intangible assets of £344 million (2012 - £106 million).
(10) Includes sovereign debt impairment of £1,099 million and related interest rate hedge adjustments of £169 million in 2011.
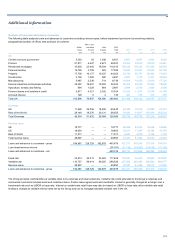
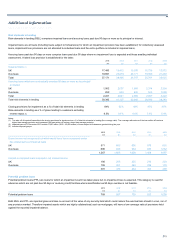
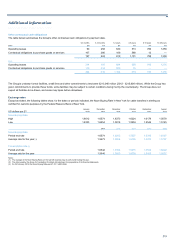
2013 2012* 2011* 2010* 2009*
Summary consolidated balance sheet £m £m £m £m £m
Loans and advances 494,793 564,086 598,916 655,778 820,146
Debt securities and equity shares 122,410 172,670 224,263 239,678 286,782
Derivatives and settlement balances 293,630 447,644 537,389 438,682 453,487
Other assets 117,045 127,895 146,299 119,438 136,071
Total assets 1,027,878 1,312,295 1,506,867 1,453,576 1,696,486
Owners' equity 58,742 68,678 75,367 75,680 78,392
Non-controlling interests 473 1,770 686 1,171 16,239
Subordinated liabilities 24,012 26,773 26,319 27,053 37,652
Deposits 534,859 622,684 611,759 609,483 756,346
Derivatives, settlement balances and short positions 318,861 467,802 572,499 478,076 475,017
Other liabilities 90,931 124,588 220,237 262,113 332,840
Total liabilities and equity 1,027,878 1,312,295 1,506,867 1,453,576 1,696,486
*Restated