RBS 2013 Annual Report Download - page 80
Download and view the complete annual report
Please find page 80 of the 2013 RBS annual report below. You can navigate through the pages in the report by either clicking on the pages listed below, or by using the keyword search tool below to find specific information within the annual report.-
 1
1 -
2
-
3
-
4
-
5
-
6
-
7
-
8
-
9
-
10
-
11
-
12
-
13
-
14
-
15
-
16
-
17
-
18
-
19
-
20
-
21
-
22
-
23
-
24
-
25
-
26
-
27
-
28
-
29
-
30
-
31
-
32
-
33
-
34
-
35
-
36
-
37
-
38
-
39
-
40
-
41
-
42
-
43
-
44
-
45
-
46
-
47
-
48
-
49
-
50
-
51
-
52
-
53
-
54
-
55
-
56
-
57
-
58
-
59
-
60
-
61
-
62
-
63
-
64
-
65
-
66
-
67
-
68
-
69
-
 70
70 -
 71
71 -
 72
72 -
 73
73 -
 74
74 -
 75
75 -
 76
76 -
 77
77 -
 78
78 -
 79
79 -
 80
80 -
 81
81 -
 82
82 -
 83
83 -
 84
84 -
 85
85 -
 86
86 -
 87
87 -
 88
88 -
 89
89 -
 90
90 -
91
-
92
-
93
-
94
-
95
-
96
-
97
-
98
-
99
-
100
-
101
-
102
-
103
-
104
-
105
-
106
-
107
-
108
-
109
-
110
-
111
-
112
-
113
-
114
-
115
-
116
-
117
-
118
-
119
-
120
-
121
-
122
-
123
-
124
-
125
-
126
-
127
-
128
-
129
-
130
-
131
-
132
-
133
-
134
-
135
-
136
-
137
-
138
-
139
-
140
-
141
-
142
-
143
-
144
-
145
-
146
-
147
-
148
-
149
-
150
-
151
-
152
-
153
-
154
-
155
-
156
-
157
-
158
-
159
-
160
-
161
-
162
-
163
-
164
-
165
-
166
-
167
-
168
-
169
-
170
-
171
-
172
-
173
-
174
-
175
-
176
-
177
-
178
-
179
-
180
-
181
-
182
-
183
-
184
-
185
-
186
-
187
-
188
-
189
-
190
-
191
-
192
-
193
-
194
-
195
-
196
-
197
-
198
-
199
-
200
-
201
-
202
-
203
-
204
-
205
-
206
-
207
-
208
-
209
-
210
-
211
-
212
-
213
-
214
-
215
-
216
-
217
-
218
-
219
-
220
-
221
-
222
-
223
-
224
-
225
-
226
-
227
-
228
-
229
-
230
-
231
-
232
-
233
-
234
-
235
-
236
-
237
-
238
-
239
-
240
-
241
-
242
-
243
-
244
-
245
-
246
-
247
-
248
-
249
-
250
-
251
-
252
-
253
-
254
-
255
-
256
-
257
-
258
-
259
-
260
-
261
-
262
-
263
-
264
-
265
-
266
-
267
-
268
-
269
-
270
-
271
-
272
-
273
-
274
-
275
-
276
-
277
-
278
-
279
-
280
-
281
-
282
-
283
-
284
-
285
-
286
-
287
-
288
-
289
-
290
-
291
-
292
-
293
-
294
-
295
-
296
-
297
-
298
-
299
-
300
-
301
-
302
-
303
-
304
-
305
-
306
-
307
-
308
-
309
-
310
-
311
-
312
-
313
-
314
-
315
-
316
-
317
-
318
-
319
-
320
-
321
-
322
-
323
-
324
-
325
-
326
-
327
-
328
-
329
-
330
-
331
-
332
-
333
-
334
-
335
-
336
-
337
-
338
-
339
-
340
-
341
-
342
-
343
-
344
-
345
-
346
-
347
-
348
-
349
-
350
-
351
-
352
-
353
-
354
-
355
-
356
-
357
-
358
-
359
-
360
-
361
-
362
-
363
-
364
-
365
-
366
-
367
-
368
-
369
-
370
-
371
-
372
-
373
-
374
-
375
-
376
-
377
-
378
-
379
-
380
-
381
-
382
-
383
-
384
-
385
-
386
-
387
-
388
-
389
-
390
-
391
-
392
-
393
-
394
-
395
-
396
-
397
-
398
-
399
-
400
-
401
-
402
-
403
-
404
-
405
-
406
-
407
-
408
-
409
-
410
-
411
-
412
-
413
-
414
-
415
-
416
-
417
-
418
-
419
-
420
-
421
-
422
-
423
-
424
-
425
-
426
-
427
-
428
-
429
-
430
-
431
-
432
-
433
-
434
-
435
-
436
-
437
-
438
-
439
-
440
-
441
-
442
-
443
-
444
-
445
-
446
-
447
-
448
-
449
-
450
-
451
-
452
-
453
-
454
-
455
-
456
-
457
-
458
-
459
-
460
-
461
-
462
-
463
-
464
-
465
-
466
-
467
-
468
-
469
-
470
-
471
-
472
-
473
-
474
-
475
-
476
-
477
-
478
-
479
-
480
-
481
-
482
-
483
-
484
-
485
-
486
-
487
-
488
-
489
-
490
-
491
-
492
-
493
-
494
-
495
-
496
-
497
-
498
-
499
-
500
-
501
-
502
-
503
-
504
-
505
-
506
-
507
-
508
-
509
-
510
-
511
-
512
-
513
-
514
-
515
-
516
-
517
-
518
-
519
-
520
-
521
-
522
-
523
-
524
-
525
-
526
-
527
-
528
-
529
-
530
-
531
-
532
-
533
-
534
-
535
-
536
-
537
-
538
-
539
-
540
-
541
-
542
-
543
-
544
-
545
-
546
-
547
-
548
-
549
-
550
-
551
-
552
-
553
-
554
-
555
-
556
-
557
-
558
-
559
-
560
-
561
-
562
-
563
-
564
 |
 |

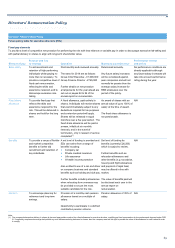
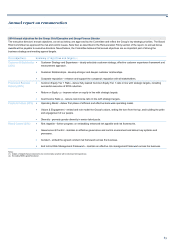
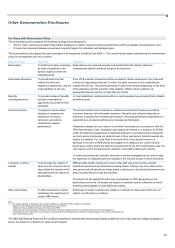
Annual report on remuneration
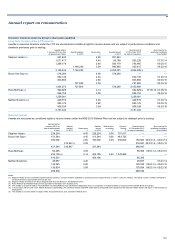
78
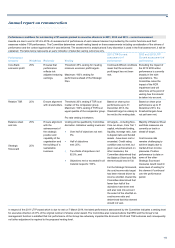
Performance conditions for outstanding LTIP awards granted to executive directors in 2011, 2012 and 2013 – current assessment
Awards are due to vest in 2014 to 2016. An assessment of performance of each relevant element is provided by the control functions and PwC
assesses relative TSR performance. The Committee determines overall vesting based on these assessments including consideration of the drivers of
performance and the context against which it was delivered. The assessment is analytical and if any discretion is used in the final assessment, it will be
explained. The table below represents an early indication of potential vesting outcomes only.
Performance
measure Weighting Rationale Vesting
2011 LTIP Current
assessment of
performance
2012 and 2013 LTIP
Current assessment of
performance
Core Bank
economic profit
25% Ensures that
performance
reflects risk
adjusted enduring
earnings.
Threshold: 25% vesting for meeting
minimum economic profit targets.
Maximum: 100% vesting for
performance ahead of the Strategic
Plan.
Continued difficult conditions
mean that the economic
profit target has not been
met.
Excluding the impact of
the 2013 RCR action
performance is currently
broadly in line with
expectations. The
Committee notes the
impact of the RCR
impairment and will
determine at the point of
vesting how this should
be taken into account.
Relative TSR 25% Ensure alignment
with shareholders.
Threshold: 20% vesting if TSR is at
median of the comparator group.
Maximum: 100% vesting if TSR is at
upper quartile of the comparator group.
Pro rata vesting in between.
Based on share price
performance up to 31
December 2013, the
threshold target is unlikely to
be met by the vesting date.
Based on share price
performance up to 31
December 2013, the
threshold targets have
not yet been met.
Balance sheet
and risk
25%
Strategic
Scorecard
25%
Ensure alignment
with the
advancement of
the strategic
position and
capability of the
organisation and
the building of a
sustainable
business.
Vesting will be qualified by Committee
discretion. Indicative vesting levels are:
• Over half of objectives not met:
0%;
• Half of objectives
met: 25%;
• Two-thirds of objectives met:
62.5%; and
• Objectives met or exceeded in all
material respects: 100%.
All targets – including Non-
Core run down, Core Tier 1
capital, wholesale funding,
liquidity, leverage ratio, loan
to deposit ratio and funded
assets - have been met or
exceeded. Credit rating
condition was not met, but
given over-achievement on
other measures, the
Committee determined that
the Balance Sheet and Risk
element would vest in full.
For the Strategic Scorecard,
the cost:income ratio target
has been missed driven by
income shortfall. Overall the
Committee determined that
fewer than half of the
objectives have been met
and also took into account
the extent of the shortfall on
cost:income ratio and
determined that this element
should not vest.
Majority of Balance Sheet
and Risk measures are
currently on track or
ahead of target.
Cost:income ratio
remains challenging to
achieve largely due to
market-driven income
pressures. Positive
performance to date on
some of the other
Strategic Scorecard
measures would result in
some level of vesting for
this element if continued
over the performance
period.
In respect of the 2011 LTIP award which is due to vest on 7 March 2014, the latest performance assessment by the Committee indicates a vesting level
for executive directors of 27% of the original number of shares under award. The Committee also received advice that BRC and the Group’s risk
management function is satisfied that risk performance of the Group has adversely impacted the Economic Profit and TSR outcomes and consequently
no further adjustment is required to the proposed vesting level.