RBS 2013 Annual Report Download - page 349
Download and view the complete annual report
Please find page 349 of the 2013 RBS annual report below. You can navigate through the pages in the report by either clicking on the pages listed below, or by using the keyword search tool below to find specific information within the annual report.-
 1
1 -
2
-
3
-
4
-
5
-
6
-
7
-
8
-
9
-
10
-
11
-
12
-
13
-
14
-
15
-
16
-
17
-
18
-
19
-
20
-
21
-
22
-
23
-
24
-
25
-
26
-
27
-
28
-
29
-
30
-
31
-
32
-
33
-
34
-
35
-
36
-
37
-
38
-
39
-
40
-
41
-
42
-
43
-
44
-
45
-
46
-
47
-
48
-
49
-
50
-
51
-
52
-
53
-
54
-
55
-
56
-
57
-
58
-
59
-
60
-
61
-
62
-
63
-
64
-
65
-
66
-
67
-
68
-
69
-
70
-
71
-
72
-
73
-
74
-
75
-
76
-
77
-
78
-
79
-
80
-
81
-
82
-
83
-
84
-
85
-
86
-
87
-
88
-
89
-
90
-
91
-
92
-
93
-
94
-
95
-
96
-
97
-
98
-
99
-
100
-
101
-
102
-
103
-
104
-
105
-
106
-
107
-
108
-
109
-
110
-
111
-
112
-
113
-
114
-
115
-
116
-
117
-
118
-
119
-
120
-
121
-
122
-
123
-
124
-
125
-
126
-
127
-
128
-
129
-
130
-
131
-
132
-
133
-
134
-
135
-
136
-
137
-
138
-
139
-
140
-
141
-
142
-
143
-
144
-
145
-
146
-
147
-
148
-
149
-
150
-
151
-
152
-
153
-
154
-
155
-
156
-
157
-
158
-
159
-
160
-
161
-
162
-
163
-
164
-
165
-
166
-
167
-
168
-
169
-
170
-
171
-
172
-
173
-
174
-
175
-
176
-
177
-
178
-
179
-
180
-
181
-
182
-
183
-
184
-
185
-
186
-
187
-
188
-
189
-
190
-
191
-
192
-
193
-
194
-
195
-
196
-
197
-
198
-
199
-
200
-
201
-
202
-
203
-
204
-
205
-
206
-
207
-
208
-
209
-
210
-
211
-
212
-
213
-
214
-
215
-
216
-
217
-
218
-
219
-
220
-
221
-
222
-
223
-
224
-
225
-
226
-
227
-
228
-
229
-
230
-
231
-
232
-
233
-
234
-
235
-
236
-
237
-
238
-
239
-
240
-
241
-
242
-
243
-
244
-
245
-
246
-
247
-
248
-
249
-
250
-
251
-
252
-
253
-
254
-
255
-
256
-
257
-
258
-
259
-
260
-
261
-
262
-
263
-
264
-
265
-
266
-
267
-
268
-
269
-
270
-
271
-
272
-
273
-
274
-
275
-
276
-
277
-
278
-
279
-
280
-
281
-
282
-
283
-
284
-
285
-
286
-
287
-
288
-
289
-
290
-
291
-
292
-
293
-
294
-
295
-
296
-
297
-
298
-
299
-
300
-
301
-
302
-
303
-
304
-
305
-
306
-
307
-
308
-
309
-
310
-
311
-
312
-
313
-
314
-
315
-
316
-
317
-
318
-
319
-
320
-
321
-
322
-
323
-
324
-
325
-
326
-
327
-
328
-
329
-
330
-
331
-
332
-
333
-
334
-
335
-
336
-
337
-
338
-
 339
339 -
 340
340 -
 341
341 -
 342
342 -
 343
343 -
 344
344 -
 345
345 -
 346
346 -
 347
347 -
 348
348 -
 349
349 -
 350
350 -
 351
351 -
 352
352 -
 353
353 -
 354
354 -
 355
355 -
 356
356 -
 357
357 -
 358
358 -
 359
359 -
360
-
361
-
362
-
363
-
364
-
365
-
366
-
367
-
368
-
369
-
370
-
371
-
372
-
373
-
374
-
375
-
376
-
377
-
378
-
379
-
380
-
381
-
382
-
383
-
384
-
385
-
386
-
387
-
388
-
389
-
390
-
391
-
392
-
393
-
394
-
395
-
396
-
397
-
398
-
399
-
400
-
401
-
402
-
403
-
404
-
405
-
406
-
407
-
408
-
409
-
410
-
411
-
412
-
413
-
414
-
415
-
416
-
417
-
418
-
419
-
420
-
421
-
422
-
423
-
424
-
425
-
426
-
427
-
428
-
429
-
430
-
431
-
432
-
433
-
434
-
435
-
436
-
437
-
438
-
439
-
440
-
441
-
442
-
443
-
444
-
445
-
446
-
447
-
448
-
449
-
450
-
451
-
452
-
453
-
454
-
455
-
456
-
457
-
458
-
459
-
460
-
461
-
462
-
463
-
464
-
465
-
466
-
467
-
468
-
469
-
470
-
471
-
472
-
473
-
474
-
475
-
476
-
477
-
478
-
479
-
480
-
481
-
482
-
483
-
484
-
485
-
486
-
487
-
488
-
489
-
490
-
491
-
492
-
493
-
494
-
495
-
496
-
497
-
498
-
499
-
500
-
501
-
502
-
503
-
504
-
505
-
506
-
507
-
508
-
509
-
510
-
511
-
512
-
513
-
514
-
515
-
516
-
517
-
518
-
519
-
520
-
521
-
522
-
523
-
524
-
525
-
526
-
527
-
528
-
529
-
530
-
531
-
532
-
533
-
534
-
535
-
536
-
537
-
538
-
539
-
540
-
541
-
542
-
543
-
544
-
545
-
546
-
547
-
548
-
549
-
550
-
551
-
552
-
553
-
554
-
555
-
556
-
557
-
558
-
559
-
560
-
561
-
562
-
563
-
564
 |
 |

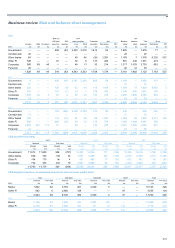
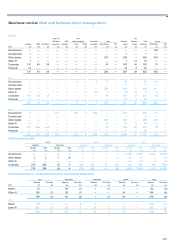
Business review Risk and balance sheet management
347
CDS
Lending Debt securities Off- notional
Central Othe
r
Othe
r
Total AFS & HFT Net Balance balance Total less fai
r
Gross
Govt banks banks FI Corporate Personal lending LAR (net) Derivatives SFT shee
t
sheet exposure value Derivatives SFT
2011 £m £m £m £m £m £m £m £m £m £m £m £m £m £m £m £m £m
Eurozone
Ireland 45 1,467 137 320 19,098 18,855 39,922 488 398 1,815 539 43,162 2,872 46,034 53 20,466 4,622
Spain 9 3 90 172 5,782 362 6,418 6,514 (359) 2,391 2 14,966 2,598 17,564 (1,013) 6,775 589
Italy — 73 233 488 2,454 23 3,271 1,583 (325) 2,381 — 6,910 3,498 10,408 (452) 11,016 305
Portugal — — 10 — 495 5 510 194 (81) 520 — 1,143 460 1,603 55 634 217
Greece 7 6 — 31 307 11 362 312 97 337 — 1,108 67 1,175 1 524 —
Cyprus — — — 2 139 13 154 — 2 24 — 180 39 219 — 25 182
Eurozone
periphery 61 1,549 470 1,013 28,275 19,269 50,637 9,091 (268) 7,468 541 67,469 9,534 77,003 (1,356) 39,440 5,915
Germany — 18,068 665 311 7,111 156 26,311 14,083 1,684 10,697 165 52,940 7,732 60,672 (2,401) 69,209 6,047
Netherlands 8 7,654 593 1,184 4,510 19 13,968 9,252 641 9,997 197 34,055 12,825 46,880 (1,295) 25,692 6,225
France 481 3 1,267 282 3,742 78 5,853 4,439 3,355 8,700 557 22,904 10,085 32,989 (2,846) 46,223 24,606
Belgium — 8 288 354 555 20 1,225 749 (97) 2,957 51 4,885 1,263 6,148 (99) 8,996 1,949
Luxembourg — — 132 494 1,363 2 1,991 69 61 1,567 41 3,729 1,990 5,719 (404) 2,826 519
Other 121 — 28 77 1,279 12 1,517 624 84 1,891 — 4,116 1,297 5,413 (25) 10,403 977
Total
eurozone 671 27,282 3,443 3,715 46,835 19,556 101,502 38,307 5,460 43,277 1,552 190,098 44,726 234,824 (8,426) 202,789 46,238
Other countries
Japan 2,073 — 694 96 460 52 3,375 3,779 8,677 2,443 191 18,465 403 18,868 (365) 15,425 12,678
China 9 178 1,309 16 976 32 2,520 427 170 421 3 3,541 1,526 5,067 (62) 426 4,029
India — 275 553 35 3,017 127 4,007 703 827 217 — 5,754 1,281 7,035 (105) 554 72
Russia — 36 970 8 901 60 1,975 78 108 176 — 2,337 368 2,705 (343) 177 18
South Korea — 5 814 2 573 3 1,397 280 565 250 145 2,637 624 3,261 (22) 776 340
Turkey 215 193 252 455 1,106 16 2,237 349 12 91 — 2,689 456 3,145 10 107 139
Brazil — — 688 131 228 4 1,051 19 771 256 — 2,097 384 2,481 164 297 —
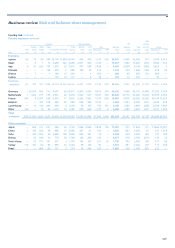
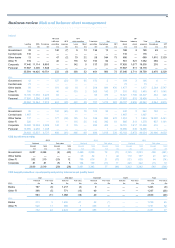
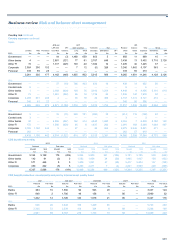
Key points*
• During 2013, the US dollar depreciated by 2.3% against sterling,
whereas the euro appreciated by 2.2%, impacting exposures.
• Balance sheet and off-balance sheet exposures to nearly all
countries declined across all broad product categories. This was
because the Group maintained a cautious stance and many clients
reduced debt levels. Non-Core lending declined in most countries,
particularly in Spain, the Netherlands, France and Romania,
reflecting the Group’s risk reduction strategy.
*unaudited
• Most of the Group’s country risk exposure was in International
Banking (primarily trade facilities, other lending and off-balance
sheet exposure to corporates and financial institutions); Markets
(principally derivatives and securities financing transactions with
financial institutions, and HFT debt securities); Ulster Bank (mostly
lending to consumers and corporates in Ireland); and Group
Treasury (largely cash balances at central banks and AFS debt
securities including Spanish cedulas).
• Total eurozone - balance sheet exposure declined by £49.2 billion or
30% to £114.2 billion, caused mostly by significant reductions in
liquidity held with the Bundesbank and in derivatives exposure to
banks. Most of the latter reductions related to counterparties in the
Netherlands, Germany and France, and were largely due to the sale
of a part of the Group’s CDS positions.