RBS 2013 Annual Report Download - page 232
Download and view the complete annual report
Please find page 232 of the 2013 RBS annual report below. You can navigate through the pages in the report by either clicking on the pages listed below, or by using the keyword search tool below to find specific information within the annual report.-
 1
1 -
2
-
3
-
4
-
5
-
6
-
7
-
8
-
9
-
10
-
11
-
12
-
13
-
14
-
15
-
16
-
17
-
18
-
19
-
20
-
21
-
22
-
23
-
24
-
25
-
26
-
27
-
28
-
29
-
30
-
31
-
32
-
33
-
34
-
35
-
36
-
37
-
38
-
39
-
40
-
41
-
42
-
43
-
44
-
45
-
46
-
47
-
48
-
49
-
50
-
51
-
52
-
53
-
54
-
55
-
56
-
57
-
58
-
59
-
60
-
61
-
62
-
63
-
64
-
65
-
66
-
67
-
68
-
69
-
70
-
71
-
72
-
73
-
74
-
75
-
76
-
77
-
78
-
79
-
80
-
81
-
82
-
83
-
84
-
85
-
86
-
87
-
88
-
89
-
90
-
91
-
92
-
93
-
94
-
95
-
96
-
97
-
98
-
99
-
100
-
101
-
102
-
103
-
104
-
105
-
106
-
107
-
108
-
109
-
110
-
111
-
112
-
113
-
114
-
115
-
116
-
117
-
118
-
119
-
120
-
121
-
122
-
123
-
124
-
125
-
126
-
127
-
128
-
129
-
130
-
131
-
132
-
133
-
134
-
135
-
136
-
137
-
138
-
139
-
140
-
141
-
142
-
143
-
144
-
145
-
146
-
147
-
148
-
149
-
150
-
151
-
152
-
153
-
154
-
155
-
156
-
157
-
158
-
159
-
160
-
161
-
162
-
163
-
164
-
165
-
166
-
167
-
168
-
169
-
170
-
171
-
172
-
173
-
174
-
175
-
176
-
177
-
178
-
179
-
180
-
181
-
182
-
183
-
184
-
185
-
186
-
187
-
188
-
189
-
190
-
191
-
192
-
193
-
194
-
195
-
196
-
197
-
198
-
199
-
200
-
201
-
202
-
203
-
204
-
205
-
206
-
207
-
208
-
209
-
210
-
211
-
212
-
213
-
214
-
215
-
216
-
217
-
218
-
219
-
220
-
221
-
 222
222 -
 223
223 -
 224
224 -
 225
225 -
 226
226 -
 227
227 -
 228
228 -
 229
229 -
 230
230 -
 231
231 -
 232
232 -
 233
233 -
 234
234 -
 235
235 -
 236
236 -
 237
237 -
 238
238 -
 239
239 -
 240
240 -
 241
241 -
 242
242 -
243
-
244
-
245
-
246
-
247
-
248
-
249
-
250
-
251
-
252
-
253
-
254
-
255
-
256
-
257
-
258
-
259
-
260
-
261
-
262
-
263
-
264
-
265
-
266
-
267
-
268
-
269
-
270
-
271
-
272
-
273
-
274
-
275
-
276
-
277
-
278
-
279
-
280
-
281
-
282
-
283
-
284
-
285
-
286
-
287
-
288
-
289
-
290
-
291
-
292
-
293
-
294
-
295
-
296
-
297
-
298
-
299
-
300
-
301
-
302
-
303
-
304
-
305
-
306
-
307
-
308
-
309
-
310
-
311
-
312
-
313
-
314
-
315
-
316
-
317
-
318
-
319
-
320
-
321
-
322
-
323
-
324
-
325
-
326
-
327
-
328
-
329
-
330
-
331
-
332
-
333
-
334
-
335
-
336
-
337
-
338
-
339
-
340
-
341
-
342
-
343
-
344
-
345
-
346
-
347
-
348
-
349
-
350
-
351
-
352
-
353
-
354
-
355
-
356
-
357
-
358
-
359
-
360
-
361
-
362
-
363
-
364
-
365
-
366
-
367
-
368
-
369
-
370
-
371
-
372
-
373
-
374
-
375
-
376
-
377
-
378
-
379
-
380
-
381
-
382
-
383
-
384
-
385
-
386
-
387
-
388
-
389
-
390
-
391
-
392
-
393
-
394
-
395
-
396
-
397
-
398
-
399
-
400
-
401
-
402
-
403
-
404
-
405
-
406
-
407
-
408
-
409
-
410
-
411
-
412
-
413
-
414
-
415
-
416
-
417
-
418
-
419
-
420
-
421
-
422
-
423
-
424
-
425
-
426
-
427
-
428
-
429
-
430
-
431
-
432
-
433
-
434
-
435
-
436
-
437
-
438
-
439
-
440
-
441
-
442
-
443
-
444
-
445
-
446
-
447
-
448
-
449
-
450
-
451
-
452
-
453
-
454
-
455
-
456
-
457
-
458
-
459
-
460
-
461
-
462
-
463
-
464
-
465
-
466
-
467
-
468
-
469
-
470
-
471
-
472
-
473
-
474
-
475
-
476
-
477
-
478
-
479
-
480
-
481
-
482
-
483
-
484
-
485
-
486
-
487
-
488
-
489
-
490
-
491
-
492
-
493
-
494
-
495
-
496
-
497
-
498
-
499
-
500
-
501
-
502
-
503
-
504
-
505
-
506
-
507
-
508
-
509
-
510
-
511
-
512
-
513
-
514
-
515
-
516
-
517
-
518
-
519
-
520
-
521
-
522
-
523
-
524
-
525
-
526
-
527
-
528
-
529
-
530
-
531
-
532
-
533
-
534
-
535
-
536
-
537
-
538
-
539
-
540
-
541
-
542
-
543
-
544
-
545
-
546
-
547
-
548
-
549
-
550
-
551
-
552
-
553
-
554
-
555
-
556
-
557
-
558
-
559
-
560
-
561
-
562
-
563
-
564
 |
 |

Business review Risk and balance sheet management
230
Credit risk continued
Risk management* continued
Retail
Retail lending entails making a large number of small value loans. To
ensure that it makes these lending decisions consistently, the Group
analyses the historical debt servicing behaviour of customers, including
their behaviour with respect to their other lenders. The Group then uses
the results of these analyses to set its lending rules, developing different
rules for different products. The resulting credit decision making process
is then largely automated, with customers receiving a credit score that
reflects the outcome of a comparison of their credit profile with the rule
set. However, in the case of relatively high value, complex personal or
small business loans, including some residential mortgage lending,
specialist credit managers make the final lending decisions.
Controls and assurance
The Group’s credit control and assurance framework has three key
components: credit policy; policy compliance assurance; and
independent assurance. These apply to both wholesale and retail credit
risk at both portfolio and individual customer level.
The first component is the Group Credit Policy Standard, which is part of
the Group Policy Framework. It sets out the rules the Group’s businesses
must follow to ensure that credit risks are identified and effectively
managed through the credit lifecycle.
The second component is a policy assurance activity that GCR
undertakes to provide the GCCO with evidence of the effectiveness of
credit risk management controls in place across the Group. The results of
these reviews are presented to the Group Credit Risk Committee on a
regular basis in support of the self-certification that GCR must complete
from time to time.
The third component of the Group’s credit assurance framework is the
Credit Quality Assurance (CQA) function. CQA independently reviews the
Group’s lending activities to identify control breaches, assess portfolio
quality and recommend process improvements. These findings are
escalated to senior management and plans to address shortcomings are
recorded and tracked in the Group’s operational risk system. CQA’s
activities are overseen by GAC and the results of its reviews are regularly
shared with the Group’s main regulators.
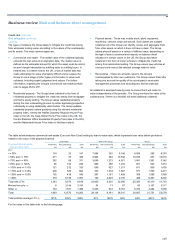
Risk measurement*
The Group uses a range of measures for credit risk exposures. The
internal measure used, unless otherwise stated, is credit risk assets
(CRA) consisting of:
• Lending exposure - measured using drawn balances and includes
cash balances at central banks and loans and advances to banks
and customers (including overdraft facilities, instalment credit and
finance leases).
*unaudited
• Counterparty exposures - measured using marked-to-market value
of derivatives after the effect of enforceable netting agreements and
regulatory approved models but before the effect of collateral.
Counterparty exposures include rate risk management, which
includes exposures arising from foreign exchange transactions,
interest rate swaps, credit default swaps and options. Exposures are
mitigated by off-setting in-the-money and out-of-the-money
transactions where such transactions are governed by legally
enforceable netting agreements and exposures are calculated by
regulatory approved models. Exposures are shown before deducting
collateral.
• Contingent obligations - measured using the value of the committed
amount and including primarily letters of credit and guarantees.
CRA exclude issuer risk (primarily debt securities) and securities
financing, repurchase and reverse repurchase arrangements. CRAs take
account of regulatory netting although, in practice, obligations are settled
under legal netting arrangements that provide a right of legal set-off but
do not meet the offset criteria under IFRS.
Credit risk models
The Group uses credit risk models in the credit approval process,
ongoing credit risk management, monitoring and reporting and portfolio
analytics. These may be divided into three categories:
Probability of default (PD)
PD models assess the probability of a customer failing its credit
obligations over a one year period.
• Wholesale models - A number of credit grading models are in place
that consider risk characteristics relevant to different customer
types. These models use a combination of quantitative inputs, such
as recent financial performance, and qualitative inputs such as
management performance or sector outlook. As part of the credit
assessment process, the Group assigns each customer an internal
credit grade based on its PD.
• Retail models - Each customer account is scored and models are
used to assign a PD. Inputs vary across portfolios and include both
internal account and customer level data, as well as data from credit
bureaus. This score is used to support automated credit decision
making through the use of a statistically derived scorecard.
Exposure at default (EAD)
EAD models provide estimates of the level of use of a credit facility at the
time of a customer's default, recognising that customers may make
further drawings on unused credit facilities prior to default. Regulatory
requirements determine that EAD is always equal to or higher than
current utilisation. Exposure can be reduced by a netting agreement,
subject to meeting standards of legal enforceability.