RBS 2013 Annual Report Download - page 417
Download and view the complete annual report
Please find page 417 of the 2013 RBS annual report below. You can navigate through the pages in the report by either clicking on the pages listed below, or by using the keyword search tool below to find specific information within the annual report.-
 1
1 -
2
-
3
-
4
-
5
-
6
-
7
-
8
-
9
-
10
-
11
-
12
-
13
-
14
-
15
-
16
-
17
-
18
-
19
-
20
-
21
-
22
-
23
-
24
-
25
-
26
-
27
-
28
-
29
-
30
-
31
-
32
-
33
-
34
-
35
-
36
-
37
-
38
-
39
-
40
-
41
-
42
-
43
-
44
-
45
-
46
-
47
-
48
-
49
-
50
-
51
-
52
-
53
-
54
-
55
-
56
-
57
-
58
-
59
-
60
-
61
-
62
-
63
-
64
-
65
-
66
-
67
-
68
-
69
-
70
-
71
-
72
-
73
-
74
-
75
-
76
-
77
-
78
-
79
-
80
-
81
-
82
-
83
-
84
-
85
-
86
-
87
-
88
-
89
-
90
-
91
-
92
-
93
-
94
-
95
-
96
-
97
-
98
-
99
-
100
-
101
-
102
-
103
-
104
-
105
-
106
-
107
-
108
-
109
-
110
-
111
-
112
-
113
-
114
-
115
-
116
-
117
-
118
-
119
-
120
-
121
-
122
-
123
-
124
-
125
-
126
-
127
-
128
-
129
-
130
-
131
-
132
-
133
-
134
-
135
-
136
-
137
-
138
-
139
-
140
-
141
-
142
-
143
-
144
-
145
-
146
-
147
-
148
-
149
-
150
-
151
-
152
-
153
-
154
-
155
-
156
-
157
-
158
-
159
-
160
-
161
-
162
-
163
-
164
-
165
-
166
-
167
-
168
-
169
-
170
-
171
-
172
-
173
-
174
-
175
-
176
-
177
-
178
-
179
-
180
-
181
-
182
-
183
-
184
-
185
-
186
-
187
-
188
-
189
-
190
-
191
-
192
-
193
-
194
-
195
-
196
-
197
-
198
-
199
-
200
-
201
-
202
-
203
-
204
-
205
-
206
-
207
-
208
-
209
-
210
-
211
-
212
-
213
-
214
-
215
-
216
-
217
-
218
-
219
-
220
-
221
-
222
-
223
-
224
-
225
-
226
-
227
-
228
-
229
-
230
-
231
-
232
-
233
-
234
-
235
-
236
-
237
-
238
-
239
-
240
-
241
-
242
-
243
-
244
-
245
-
246
-
247
-
248
-
249
-
250
-
251
-
252
-
253
-
254
-
255
-
256
-
257
-
258
-
259
-
260
-
261
-
262
-
263
-
264
-
265
-
266
-
267
-
268
-
269
-
270
-
271
-
272
-
273
-
274
-
275
-
276
-
277
-
278
-
279
-
280
-
281
-
282
-
283
-
284
-
285
-
286
-
287
-
288
-
289
-
290
-
291
-
292
-
293
-
294
-
295
-
296
-
297
-
298
-
299
-
300
-
301
-
302
-
303
-
304
-
305
-
306
-
307
-
308
-
309
-
310
-
311
-
312
-
313
-
314
-
315
-
316
-
317
-
318
-
319
-
320
-
321
-
322
-
323
-
324
-
325
-
326
-
327
-
328
-
329
-
330
-
331
-
332
-
333
-
334
-
335
-
336
-
337
-
338
-
339
-
340
-
341
-
342
-
343
-
344
-
345
-
346
-
347
-
348
-
349
-
350
-
351
-
352
-
353
-
354
-
355
-
356
-
357
-
358
-
359
-
360
-
361
-
362
-
363
-
364
-
365
-
366
-
367
-
368
-
369
-
370
-
371
-
372
-
373
-
374
-
375
-
376
-
377
-
378
-
379
-
380
-
381
-
382
-
383
-
384
-
385
-
386
-
387
-
388
-
389
-
390
-
391
-
392
-
393
-
394
-
395
-
396
-
397
-
398
-
399
-
400
-
401
-
402
-
403
-
404
-
405
-
406
-
 407
407 -
 408
408 -
 409
409 -
 410
410 -
 411
411 -
 412
412 -
 413
413 -
 414
414 -
 415
415 -
 416
416 -
 417
417 -
 418
418 -
 419
419 -
 420
420 -
 421
421 -
 422
422 -
 423
423 -
 424
424 -
 425
425 -
 426
426 -
 427
427 -
428
-
429
-
430
-
431
-
432
-
433
-
434
-
435
-
436
-
437
-
438
-
439
-
440
-
441
-
442
-
443
-
444
-
445
-
446
-
447
-
448
-
449
-
450
-
451
-
452
-
453
-
454
-
455
-
456
-
457
-
458
-
459
-
460
-
461
-
462
-
463
-
464
-
465
-
466
-
467
-
468
-
469
-
470
-
471
-
472
-
473
-
474
-
475
-
476
-
477
-
478
-
479
-
480
-
481
-
482
-
483
-
484
-
485
-
486
-
487
-
488
-
489
-
490
-
491
-
492
-
493
-
494
-
495
-
496
-
497
-
498
-
499
-
500
-
501
-
502
-
503
-
504
-
505
-
506
-
507
-
508
-
509
-
510
-
511
-
512
-
513
-
514
-
515
-
516
-
517
-
518
-
519
-
520
-
521
-
522
-
523
-
524
-
525
-
526
-
527
-
528
-
529
-
530
-
531
-
532
-
533
-
534
-
535
-
536
-
537
-
538
-
539
-
540
-
541
-
542
-
543
-
544
-
545
-
546
-
547
-
548
-
549
-
550
-
551
-
552
-
553
-
554
-
555
-
556
-
557
-
558
-
559
-
560
-
561
-
562
-
563
-
564
 |
 |

Notes on the consolidated accounts
415
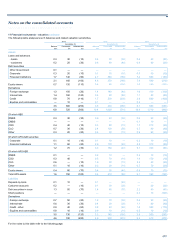
Key points
• Monoline and CDPC: reduced exposures during the year, tighter
credit spreads and exchange rate movements contributed to the
decrease in CVA.
• Other counterparties: the decrease in CVA during the year was
driven by tighter credit spreads, reduction in exposure due to market
movements together with realised default losses and reserve
releases on certain exposures following restructuring. The net
impact of updates to counterparty ratings and recovery rate
assumptions also contributed to the decrease. This was partially
offset by an increase in CVA due to methodology refinements.
• The decrease in bid-offer reserves during the year reflects risk
reduction.
• Reduction in exposure due to market moves together with the
impact of methodology refinements contributed to the decrease in
FVA. This was partially offset by additional funding related reserves
and uncollateralised derivatives in Q4 2013.
Monoline insurers
The Group’s exposure to monolines is predominately credit default swaps
(CDSs) referencing ABS held directly or synthetically.
For the majority of trades the gross mark-to-market of the monoline
protection is determined directly from the fair value price of the underlying
reference instrument. However, for the remainder of the trades the gross
mark-to-market is determined using industry standard models.
The CVA methodology uses market implied probability of defaults and
internally assessed recovery rates to determine the level of expected loss
on monoline exposures of different maturities. The probability of default is
calculated with reference to market observable credit spreads and
recovery levels. CVA is calculated at a trade level by applying the
expected loss corresponding to each trade’s expected maturity, to the
gross mark-to-market of the monoline protection. The expected maturity
of each trade reflects the scheduled notional amortisation of the
underlying reference instruments and whether payments due from the
monoline are received at the point of default or over the life of the
underlying reference instruments.
Credit derivative product companies (CDPC)
A CDPC is a company that sells protection on credit derivatives. CDPCs
are similar to monoline insurers, however they are not regulated as
insurers. The Group's exposure to CDPCs is predominantly due to
tranched credit derivatives (“tranches”). A tranche references a portfolio
of loans and bonds and provides protection against total portfolio default
losses exceeding a certain percentage of the portfolio notional (the
attachment point) up to another percentage (the detachment point).
The gross mark-to-market of the CDPC protection is determined using
industry standard models. The table above includes valuation
adjustments of £34 million relating to certain CDPCs which reflect trade
restructuring levels of similar exposures in 2012. For trades facing other
CDPCs, the CVA methodology is different to that outlined above for
monolines, as there are no market observable credit spreads and
recovery levels for these entities. The level of expected loss on these
CDPC exposures is estimated with reference to risk mitigation strategies.
Other counterparties
The CVA for all other counterparties is calculated on a portfolio basis
reflecting an estimate of the amount a third party would charge to assume
the credit risk.
Where a positive exposure exists to a counterparty that is considered to
be close to default, the CVA is calculated by applying expected losses to
the current level of exposure. Otherwise, expected losses are applied to
estimated potential future positive exposures which are modelled to
reflect the volatility of the market factors which drive the exposures and
the correlation between those factors.
Potential future positive exposures arising from vanilla products (including
interest rate and foreign exchange derivatives) are modelled using the
Group's core counterparty risk systems. The majority of the Group's CVA
held in relation to other counterparties arises on these vanilla products
together with exposures to counterparties which are considered to be
close to default. The exposures arising from all other product types are
modelled and assessed separately. The potential future positive
exposure to each counterparty is the aggregate of the exposures arising
on the underlying product types.
Expected losses are determined from market implied probabilities of
default and internally assessed recovery levels. The probability of default
is calculated with reference to observable credit spreads and observable
recovery levels. For counterparties where observable data do not exist,
the probability of default is determined from the credit spreads and
recovery levels of similarly rated entities. Weightings that were previously
applied in the expected losses calculation were removed during 2013 in
line with market developments.
The correlation between exposure and counterparty risk is also
incorporated within the CVA calculation where this risk is considered
significant. The risk primarily arises on credit derivative trades where the
default risk of the referenced entity is correlated with the counterparty
risk. The risk also arises on trades with emerging market counterparties
where the gross mark-to-market value of the trade, and
therefore the counterparty exposure, increases as the strength of the
local currency declines.
Collateral held under a credit support agreement is factored into the CVA
calculation. In such cases where the Group holds collateral against
counterparty exposures, CVA is held to the extent that residual risk
remains.