RBS 2013 Annual Report Download - page 463
Download and view the complete annual report
Please find page 463 of the 2013 RBS annual report below. You can navigate through the pages in the report by either clicking on the pages listed below, or by using the keyword search tool below to find specific information within the annual report.-
 1
1 -
2
-
3
-
4
-
5
-
6
-
7
-
8
-
9
-
10
-
11
-
12
-
13
-
14
-
15
-
16
-
17
-
18
-
19
-
20
-
21
-
22
-
23
-
24
-
25
-
26
-
27
-
28
-
29
-
30
-
31
-
32
-
33
-
34
-
35
-
36
-
37
-
38
-
39
-
40
-
41
-
42
-
43
-
44
-
45
-
46
-
47
-
48
-
49
-
50
-
51
-
52
-
53
-
54
-
55
-
56
-
57
-
58
-
59
-
60
-
61
-
62
-
63
-
64
-
65
-
66
-
67
-
68
-
69
-
70
-
71
-
72
-
73
-
74
-
75
-
76
-
77
-
78
-
79
-
80
-
81
-
82
-
83
-
84
-
85
-
86
-
87
-
88
-
89
-
90
-
91
-
92
-
93
-
94
-
95
-
96
-
97
-
98
-
99
-
100
-
101
-
102
-
103
-
104
-
105
-
106
-
107
-
108
-
109
-
110
-
111
-
112
-
113
-
114
-
115
-
116
-
117
-
118
-
119
-
120
-
121
-
122
-
123
-
124
-
125
-
126
-
127
-
128
-
129
-
130
-
131
-
132
-
133
-
134
-
135
-
136
-
137
-
138
-
139
-
140
-
141
-
142
-
143
-
144
-
145
-
146
-
147
-
148
-
149
-
150
-
151
-
152
-
153
-
154
-
155
-
156
-
157
-
158
-
159
-
160
-
161
-
162
-
163
-
164
-
165
-
166
-
167
-
168
-
169
-
170
-
171
-
172
-
173
-
174
-
175
-
176
-
177
-
178
-
179
-
180
-
181
-
182
-
183
-
184
-
185
-
186
-
187
-
188
-
189
-
190
-
191
-
192
-
193
-
194
-
195
-
196
-
197
-
198
-
199
-
200
-
201
-
202
-
203
-
204
-
205
-
206
-
207
-
208
-
209
-
210
-
211
-
212
-
213
-
214
-
215
-
216
-
217
-
218
-
219
-
220
-
221
-
222
-
223
-
224
-
225
-
226
-
227
-
228
-
229
-
230
-
231
-
232
-
233
-
234
-
235
-
236
-
237
-
238
-
239
-
240
-
241
-
242
-
243
-
244
-
245
-
246
-
247
-
248
-
249
-
250
-
251
-
252
-
253
-
254
-
255
-
256
-
257
-
258
-
259
-
260
-
261
-
262
-
263
-
264
-
265
-
266
-
267
-
268
-
269
-
270
-
271
-
272
-
273
-
274
-
275
-
276
-
277
-
278
-
279
-
280
-
281
-
282
-
283
-
284
-
285
-
286
-
287
-
288
-
289
-
290
-
291
-
292
-
293
-
294
-
295
-
296
-
297
-
298
-
299
-
300
-
301
-
302
-
303
-
304
-
305
-
306
-
307
-
308
-
309
-
310
-
311
-
312
-
313
-
314
-
315
-
316
-
317
-
318
-
319
-
320
-
321
-
322
-
323
-
324
-
325
-
326
-
327
-
328
-
329
-
330
-
331
-
332
-
333
-
334
-
335
-
336
-
337
-
338
-
339
-
340
-
341
-
342
-
343
-
344
-
345
-
346
-
347
-
348
-
349
-
350
-
351
-
352
-
353
-
354
-
355
-
356
-
357
-
358
-
359
-
360
-
361
-
362
-
363
-
364
-
365
-
366
-
367
-
368
-
369
-
370
-
371
-
372
-
373
-
374
-
375
-
376
-
377
-
378
-
379
-
380
-
381
-
382
-
383
-
384
-
385
-
386
-
387
-
388
-
389
-
390
-
391
-
392
-
393
-
394
-
395
-
396
-
397
-
398
-
399
-
400
-
401
-
402
-
403
-
404
-
405
-
406
-
407
-
408
-
409
-
410
-
411
-
412
-
413
-
414
-
415
-
416
-
417
-
418
-
419
-
420
-
421
-
422
-
423
-
424
-
425
-
426
-
427
-
428
-
429
-
430
-
431
-
432
-
433
-
434
-
435
-
436
-
437
-
438
-
439
-
440
-
441
-
442
-
443
-
444
-
445
-
446
-
447
-
448
-
449
-
450
-
451
-
452
-
 453
453 -
 454
454 -
 455
455 -
 456
456 -
 457
457 -
 458
458 -
 459
459 -
 460
460 -
 461
461 -
 462
462 -
 463
463 -
 464
464 -
 465
465 -
 466
466 -
 467
467 -
 468
468 -
 469
469 -
 470
470 -
 471
471 -
 472
472 -
 473
473 -
474
-
475
-
476
-
477
-
478
-
479
-
480
-
481
-
482
-
483
-
484
-
485
-
486
-
487
-
488
-
489
-
490
-
491
-
492
-
493
-
494
-
495
-
496
-
497
-
498
-
499
-
500
-
501
-
502
-
503
-
504
-
505
-
506
-
507
-
508
-
509
-
510
-
511
-
512
-
513
-
514
-
515
-
516
-
517
-
518
-
519
-
520
-
521
-
522
-
523
-
524
-
525
-
526
-
527
-
528
-
529
-
530
-
531
-
532
-
533
-
534
-
535
-
536
-
537
-
538
-
539
-
540
-
541
-
542
-
543
-
544
-
545
-
546
-
547
-
548
-
549
-
550
-
551
-
552
-
553
-
554
-
555
-
556
-
557
-
558
-
559
-
560
-
561
-
562
-
563
-
564
 |
 |

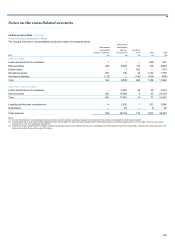
Notes on the consolidated accounts
461
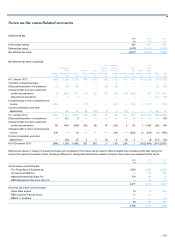
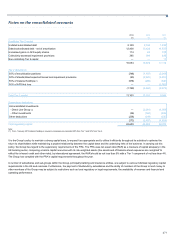
25 Non-controlling interests
Direct Line
Insurance ABN Othe
r
Group plc AMRO interests* Total*
£m £m £m £m
A
t 1 January 2012 — 283 403 686
Currency translation and other adjustments — (12) (6) (18)
(Loss)/profit attributable to non-controlling interests
- continuing operations — (43) 19 (24)
- discontinued operations (125) 13 — (112)
Losses on available-for-sale financial assets, net of tax — 25 — 25
Equity raised 873 — 2 875
Equity withdrawn and disposals — — (23) (23)
Transfer from retained earnings 361 — — 361
A
t 1 January 2013 1,109 266 395 1,770
Currency translation and other adjustments — (8) 2 (6)
Profit/(loss) attributable to non-controlling interests
- continuing operations — 95 (12) 83
- discontinued operations 19 18 — 37
Dividends paid — — (5) (5)
Losses on available-for-sale financial assets, net of tax — 23 — 23
Equity withdrawn and disposals (1,128) — (301) (1,429)
A
t 31 December 2013 — 394 79 473
* Restated
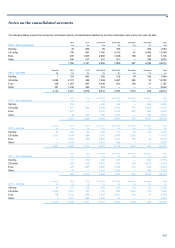
26 Share capital
Allotted, called up and fully paid
Issued
1 January during 31 December
2013 the year 2013
£m £m £m
Ordinary shares of £1 6,071 132 6,203
B shares of £0.01 510 — 510
Dividend access share of £0.01 (1) — — —
Non-cumulative preference shares of US$0.01 1 — 1
Non-cumulative convertible preference shares of US$0.01 — — —
Non-cumulative preference shares of €0.01 — — —
Non-cumulative convertible preference shares of £0.01 — — —
Non-cumulative preference shares of £1 — — —
Cumulative preference shares of £1 1 — 1
Allotted, called up and fully paid
Number of shares - thousands 2013 2012 2011
Ordinary shares of 25p (2) — — 59,228,412
Ordinary shares of £1 6,203,022 6,070,765 —
B shares of £0.01 51,000,000 51,000,000 51,000,000
Dividend access share of £0.01 (1) — — —
Non-cumulative preference shares of US$0.01 209,609 209,609 209,609
Non-cumulative convertible preference shares of US$0.01 65 65 65
Non-cumulative preference shares of €0.01 2,044 2,044 2,044
Non-cumulative convertible preference shares of £0.01 15 15 15
Non-cumulative preference shares of £1 54 54 54
Cumulative preference shares of £1 900 900 900