RBS 2013 Annual Report Download - page 139
Download and view the complete annual report
Please find page 139 of the 2013 RBS annual report below. You can navigate through the pages in the report by either clicking on the pages listed below, or by using the keyword search tool below to find specific information within the annual report.-
 1
1 -
2
-
3
-
4
-
5
-
6
-
7
-
8
-
9
-
10
-
11
-
12
-
13
-
14
-
15
-
16
-
17
-
18
-
19
-
20
-
21
-
22
-
23
-
24
-
25
-
26
-
27
-
28
-
29
-
30
-
31
-
32
-
33
-
34
-
35
-
36
-
37
-
38
-
39
-
40
-
41
-
42
-
43
-
44
-
45
-
46
-
47
-
48
-
49
-
50
-
51
-
52
-
53
-
54
-
55
-
56
-
57
-
58
-
59
-
60
-
61
-
62
-
63
-
64
-
65
-
66
-
67
-
68
-
69
-
70
-
71
-
72
-
73
-
74
-
75
-
76
-
77
-
78
-
79
-
80
-
81
-
82
-
83
-
84
-
85
-
86
-
87
-
88
-
89
-
90
-
91
-
92
-
93
-
94
-
95
-
96
-
97
-
98
-
99
-
100
-
101
-
102
-
103
-
104
-
105
-
106
-
107
-
108
-
109
-
110
-
111
-
112
-
113
-
114
-
115
-
116
-
117
-
118
-
119
-
120
-
121
-
122
-
123
-
124
-
125
-
126
-
127
-
128
-
 129
129 -
 130
130 -
 131
131 -
 132
132 -
 133
133 -
 134
134 -
 135
135 -
 136
136 -
 137
137 -
 138
138 -
 139
139 -
 140
140 -
 141
141 -
 142
142 -
 143
143 -
 144
144 -
 145
145 -
 146
146 -
 147
147 -
 148
148 -
 149
149 -
150
-
151
-
152
-
153
-
154
-
155
-
156
-
157
-
158
-
159
-
160
-
161
-
162
-
163
-
164
-
165
-
166
-
167
-
168
-
169
-
170
-
171
-
172
-
173
-
174
-
175
-
176
-
177
-
178
-
179
-
180
-
181
-
182
-
183
-
184
-
185
-
186
-
187
-
188
-
189
-
190
-
191
-
192
-
193
-
194
-
195
-
196
-
197
-
198
-
199
-
200
-
201
-
202
-
203
-
204
-
205
-
206
-
207
-
208
-
209
-
210
-
211
-
212
-
213
-
214
-
215
-
216
-
217
-
218
-
219
-
220
-
221
-
222
-
223
-
224
-
225
-
226
-
227
-
228
-
229
-
230
-
231
-
232
-
233
-
234
-
235
-
236
-
237
-
238
-
239
-
240
-
241
-
242
-
243
-
244
-
245
-
246
-
247
-
248
-
249
-
250
-
251
-
252
-
253
-
254
-
255
-
256
-
257
-
258
-
259
-
260
-
261
-
262
-
263
-
264
-
265
-
266
-
267
-
268
-
269
-
270
-
271
-
272
-
273
-
274
-
275
-
276
-
277
-
278
-
279
-
280
-
281
-
282
-
283
-
284
-
285
-
286
-
287
-
288
-
289
-
290
-
291
-
292
-
293
-
294
-
295
-
296
-
297
-
298
-
299
-
300
-
301
-
302
-
303
-
304
-
305
-
306
-
307
-
308
-
309
-
310
-
311
-
312
-
313
-
314
-
315
-
316
-
317
-
318
-
319
-
320
-
321
-
322
-
323
-
324
-
325
-
326
-
327
-
328
-
329
-
330
-
331
-
332
-
333
-
334
-
335
-
336
-
337
-
338
-
339
-
340
-
341
-
342
-
343
-
344
-
345
-
346
-
347
-
348
-
349
-
350
-
351
-
352
-
353
-
354
-
355
-
356
-
357
-
358
-
359
-
360
-
361
-
362
-
363
-
364
-
365
-
366
-
367
-
368
-
369
-
370
-
371
-
372
-
373
-
374
-
375
-
376
-
377
-
378
-
379
-
380
-
381
-
382
-
383
-
384
-
385
-
386
-
387
-
388
-
389
-
390
-
391
-
392
-
393
-
394
-
395
-
396
-
397
-
398
-
399
-
400
-
401
-
402
-
403
-
404
-
405
-
406
-
407
-
408
-
409
-
410
-
411
-
412
-
413
-
414
-
415
-
416
-
417
-
418
-
419
-
420
-
421
-
422
-
423
-
424
-
425
-
426
-
427
-
428
-
429
-
430
-
431
-
432
-
433
-
434
-
435
-
436
-
437
-
438
-
439
-
440
-
441
-
442
-
443
-
444
-
445
-
446
-
447
-
448
-
449
-
450
-
451
-
452
-
453
-
454
-
455
-
456
-
457
-
458
-
459
-
460
-
461
-
462
-
463
-
464
-
465
-
466
-
467
-
468
-
469
-
470
-
471
-
472
-
473
-
474
-
475
-
476
-
477
-
478
-
479
-
480
-
481
-
482
-
483
-
484
-
485
-
486
-
487
-
488
-
489
-
490
-
491
-
492
-
493
-
494
-
495
-
496
-
497
-
498
-
499
-
500
-
501
-
502
-
503
-
504
-
505
-
506
-
507
-
508
-
509
-
510
-
511
-
512
-
513
-
514
-
515
-
516
-
517
-
518
-
519
-
520
-
521
-
522
-
523
-
524
-
525
-
526
-
527
-
528
-
529
-
530
-
531
-
532
-
533
-
534
-
535
-
536
-
537
-
538
-
539
-
540
-
541
-
542
-
543
-
544
-
545
-
546
-
547
-
548
-
549
-
550
-
551
-
552
-
553
-
554
-
555
-
556
-
557
-
558
-
559
-
560
-
561
-
562
-
563
-
564
 |
 |

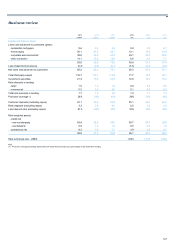
Business review
137
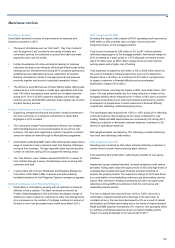
As well as delivering a range of lending initiatives, UK Corporate
continued to develop new propositions for its customers. Following a
successful pilot UK Corporate launched a leading business-to-business
online community platform, Bizcrowd, to support independent needs
matching. By the end of 2013 Bizcrowd had over 27,000 users and is
now helping to bring businesses together across the UK.
During the course of 2013 UK Corporate’s Business Banking Enterprise
Programme helped over 40,000 entrepreneurs through over 1,000
events. Through its combination of nationwide start-up surgeries, mobile
business schools and business academies, the programme offers
support and advice to aspiring entrepreneurs, new start-up businesses
and established SMEs looking to grow. Combined with UK Corporate’s
skills-based volunteering scheme, a programme offering all employees
five days to volunteer with a charitable organisation, UK Corporate
continued to deliver on its on-going commitment to communities.
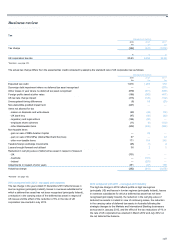
2013 compared with 2012
The business delivered a return on equity of 11.0% excluding the impact
of increased impairment losses related to the creation of RCR, primarily
property and shipping exposures, which reduced return on equity by
3.1%.
Net interest income was 3% lower at £2,874 million, as increased income
from re-pricing initiatives was offset by the lower rate environment
impacting deposit returns, the non-repeat of 2012 deferred income
recognition revisions (£58 million) and reduced lending volumes, as loan
repayments coupled with run-off in property and shipping sectors
outpaced new lending.
Non-interest income reduced 9% to £1,593 million, primarily from lower
Markets revenue share income, a decline in operating lease income
(offset by an associated reduction of operating lease depreciation in
expenses), lower lending fees and higher derivative close-out costs
associated with impaired assets.
Expenses, increased 6% to £2,219 million, primarily as a result of
remediation provisions of £68 million, an increased share of branch
network costs and an uplift in investment spend. This was offset by the
reduction in operating lease depreciation, a decline in Markets revenue
share related costs and lower staff incentive expenditure.
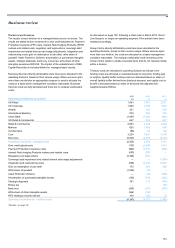
Whilst full year impairments include the additional impact of increased
impairment losses related to the creation of RCR (£410 million),
underlying impairments improved by £60 million, or 7%, to £778 million
due to lower individual and collectively assessed provisions in the SME
business, partially offset by higher individual cases in the mid-to-large
corporate business.
Risk-weighted assets were broadly in line with 2012 at £86.1 billion as
reduced asset volumes and movements into default offset increases
resulting from the implementation of risk model changes.
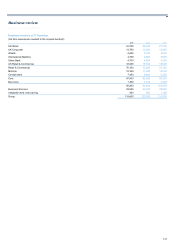
2012 compared with 2011
With economic factors continuing to suppress business confidence, 2012
saw lower income and operating profit. Nonetheless, the business
delivered a return on equity of 14.5%, slightly below the prior year and
comfortably ahead of the cost of capital.
Operating profit decreased by 7%, with income down 3% and increased
impairments, up 6%, partially offset by a 3% decrease in costs.
Net interest income was 4% lower, reflecting a 3% fall in lending volumes
as loan repayments outstripped new lending, deposit margin
compression due to strong competition and the continuation of low yields
on current accounts. This was partially offset by improved asset margins
and a 1% increase in deposit volumes.
Non-interest income was broadly in line with 2011, with stable income
from transaction services, asset finance, Markets revenue share and
other lending fees.
Total costs were down 3% due to tight control over direct discretionary
expenditure combined with lower indirect costs as a result of operational
savings, partially offset by increased investment expenditure.
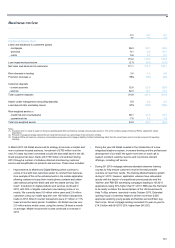
Core lending balances were up £200 million, excluding the property,
housebuilding and construction sectors. The loan:deposit ratio decreased
by 400 basis points, principally reflecting deposit growth and portfolio de-
risking, particularly in commercial real estate. The Group took part in a
number of Government initiatives, seeking responsibly to stimulate
additional credit demand in the face of continued customer deleveraging
and low business confidence levels.
Impairments increased by 6% with lower specific provisions, mainly in the
SME business, more than offset by reduced levels of latent provision
releases across the division (£44 million in 2012 versus £226 million in
2011). Impairments as a percentage of loans and advances edged up
modestly to 80 basis points.
Risk-weighted assets increased by 9% as regulatory changes to capital
models during H2 2012 totalling £15 billion (primarily the implementation
of the market-wide slotting approach on real estate and increases to
default risk weights in other models) were partly offset by a fall in funded
assets.
Not reflected in operating results was UK Corporate’s £350 million share
of the provision for interest rate swap redress which relates to prior
periods, mainly pre-2008.