RBS 2013 Annual Report Download - page 161
Download and view the complete annual report
Please find page 161 of the 2013 RBS annual report below. You can navigate through the pages in the report by either clicking on the pages listed below, or by using the keyword search tool below to find specific information within the annual report.-
 1
1 -
2
-
3
-
4
-
5
-
6
-
7
-
8
-
9
-
10
-
11
-
12
-
13
-
14
-
15
-
16
-
17
-
18
-
19
-
20
-
21
-
22
-
23
-
24
-
25
-
26
-
27
-
28
-
29
-
30
-
31
-
32
-
33
-
34
-
35
-
36
-
37
-
38
-
39
-
40
-
41
-
42
-
43
-
44
-
45
-
46
-
47
-
48
-
49
-
50
-
51
-
52
-
53
-
54
-
55
-
56
-
57
-
58
-
59
-
60
-
61
-
62
-
63
-
64
-
65
-
66
-
67
-
68
-
69
-
70
-
71
-
72
-
73
-
74
-
75
-
76
-
77
-
78
-
79
-
80
-
81
-
82
-
83
-
84
-
85
-
86
-
87
-
88
-
89
-
90
-
91
-
92
-
93
-
94
-
95
-
96
-
97
-
98
-
99
-
100
-
101
-
102
-
103
-
104
-
105
-
106
-
107
-
108
-
109
-
110
-
111
-
112
-
113
-
114
-
115
-
116
-
117
-
118
-
119
-
120
-
121
-
122
-
123
-
124
-
125
-
126
-
127
-
128
-
129
-
130
-
131
-
132
-
133
-
134
-
135
-
136
-
137
-
138
-
139
-
140
-
141
-
142
-
143
-
144
-
145
-
146
-
147
-
148
-
149
-
150
-
 151
151 -
 152
152 -
 153
153 -
 154
154 -
 155
155 -
 156
156 -
 157
157 -
 158
158 -
 159
159 -
 160
160 -
 161
161 -
 162
162 -
 163
163 -
 164
164 -
 165
165 -
 166
166 -
 167
167 -
 168
168 -
 169
169 -
 170
170 -
 171
171 -
172
-
173
-
174
-
175
-
176
-
177
-
178
-
179
-
180
-
181
-
182
-
183
-
184
-
185
-
186
-
187
-
188
-
189
-
190
-
191
-
192
-
193
-
194
-
195
-
196
-
197
-
198
-
199
-
200
-
201
-
202
-
203
-
204
-
205
-
206
-
207
-
208
-
209
-
210
-
211
-
212
-
213
-
214
-
215
-
216
-
217
-
218
-
219
-
220
-
221
-
222
-
223
-
224
-
225
-
226
-
227
-
228
-
229
-
230
-
231
-
232
-
233
-
234
-
235
-
236
-
237
-
238
-
239
-
240
-
241
-
242
-
243
-
244
-
245
-
246
-
247
-
248
-
249
-
250
-
251
-
252
-
253
-
254
-
255
-
256
-
257
-
258
-
259
-
260
-
261
-
262
-
263
-
264
-
265
-
266
-
267
-
268
-
269
-
270
-
271
-
272
-
273
-
274
-
275
-
276
-
277
-
278
-
279
-
280
-
281
-
282
-
283
-
284
-
285
-
286
-
287
-
288
-
289
-
290
-
291
-
292
-
293
-
294
-
295
-
296
-
297
-
298
-
299
-
300
-
301
-
302
-
303
-
304
-
305
-
306
-
307
-
308
-
309
-
310
-
311
-
312
-
313
-
314
-
315
-
316
-
317
-
318
-
319
-
320
-
321
-
322
-
323
-
324
-
325
-
326
-
327
-
328
-
329
-
330
-
331
-
332
-
333
-
334
-
335
-
336
-
337
-
338
-
339
-
340
-
341
-
342
-
343
-
344
-
345
-
346
-
347
-
348
-
349
-
350
-
351
-
352
-
353
-
354
-
355
-
356
-
357
-
358
-
359
-
360
-
361
-
362
-
363
-
364
-
365
-
366
-
367
-
368
-
369
-
370
-
371
-
372
-
373
-
374
-
375
-
376
-
377
-
378
-
379
-
380
-
381
-
382
-
383
-
384
-
385
-
386
-
387
-
388
-
389
-
390
-
391
-
392
-
393
-
394
-
395
-
396
-
397
-
398
-
399
-
400
-
401
-
402
-
403
-
404
-
405
-
406
-
407
-
408
-
409
-
410
-
411
-
412
-
413
-
414
-
415
-
416
-
417
-
418
-
419
-
420
-
421
-
422
-
423
-
424
-
425
-
426
-
427
-
428
-
429
-
430
-
431
-
432
-
433
-
434
-
435
-
436
-
437
-
438
-
439
-
440
-
441
-
442
-
443
-
444
-
445
-
446
-
447
-
448
-
449
-
450
-
451
-
452
-
453
-
454
-
455
-
456
-
457
-
458
-
459
-
460
-
461
-
462
-
463
-
464
-
465
-
466
-
467
-
468
-
469
-
470
-
471
-
472
-
473
-
474
-
475
-
476
-
477
-
478
-
479
-
480
-
481
-
482
-
483
-
484
-
485
-
486
-
487
-
488
-
489
-
490
-
491
-
492
-
493
-
494
-
495
-
496
-
497
-
498
-
499
-
500
-
501
-
502
-
503
-
504
-
505
-
506
-
507
-
508
-
509
-
510
-
511
-
512
-
513
-
514
-
515
-
516
-
517
-
518
-
519
-
520
-
521
-
522
-
523
-
524
-
525
-
526
-
527
-
528
-
529
-
530
-
531
-
532
-
533
-
534
-
535
-
536
-
537
-
538
-
539
-
540
-
541
-
542
-
543
-
544
-
545
-
546
-
547
-
548
-
549
-
550
-
551
-
552
-
553
-
554
-
555
-
556
-
557
-
558
-
559
-
560
-
561
-
562
-
563
-
564
 |
 |

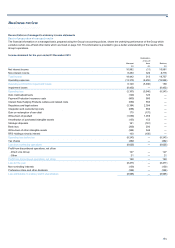
Business review
159
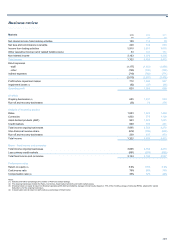
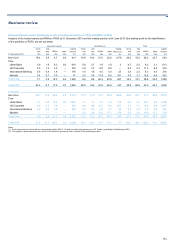
Non-Core has successfully achieved and surpassed its five year Strategic
Plan target, reducing third party assets from the opening £258 billion
position to end 2013 significantly below the original c.£40 billion target at
£28 billion. Over the life of Non-Core this represents an overall reduction
of £230 billion, or 89%. This was achieved through a mixture of
disposals, run-off and impairments. By the end of 2013, the Non-Core
funded balance sheet was c.4% of the Group’s funded balance sheet
compared with 21% when the division was created. RWAs have reduced
from £171 billion to £29 billion, or 83%, over the life of Non-Core.
Third party assets were reduced by £29 billion, or 51%, during the year.
Approximately £3.1 billion of the reduction was due to increased
impairments as a result of the change in the future run-down/disposal
plan for the remaining Non-Core assets under the transition to RCR.
2013 is the final reporting period for the Non-Core division. Approximately
£12 billion of assets which were managed by Non-Core are to be
returned to the relevant Core divisions, with the remaining assets
transferring to RCR from 1 January 2014.
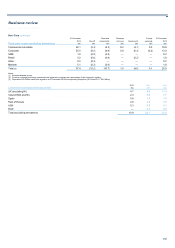
2013 compared with 2012
Third party assets declined by £29 billion, or 51%, reflecting run-off of
£15 billion, disposals of £11 billion and impairments of £5 billion, of which
£3.1 billion is driven by the new RCR strategy to exit these assets over a
shorter timeframe than previous plans.
Risk-weighted assets were £31 billion lower, driven by disposals and run-
off.
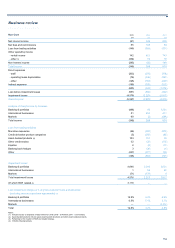
Operating loss of £5,527 million was £2,648 million higher than 2012,
principally due to a £2,353 million increase in impairments. This was
predominantly due to £3,118 million of 2013 impairments related to the
creation of RCR, most significantly with £2,299 million in Ulster Bank and
£742 million in International Banking, driven by the new RCR strategy to
exit these assets over a shorter timeframe than previous plans, which has
led to increased impairment losses on the non-performing assets.
Operating loss before impairment losses was £295 million higher with a
reduction in net interest income of £407 million, £207 million additional
disposal losses and £104 million further fair value writedowns offset by
£506 million lower losses from trading activities.
The reduction in net interest income of £407 million was driven by a 31%
fall in interest earning assets driven by run-off and disposals.
Headcount declined by 1,700, or 55% to 1,400 of which 1,000 relates to
operations in India and Romania, reflecting divestment activity and run-
off.
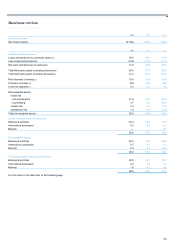
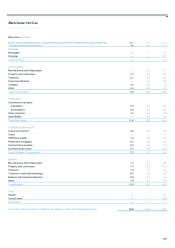
2012 compared with 2011
Third party assets declined by £35 billion, or 38%, largely reflecting
disposals of £18 billion and run-off of £16 billion. The disposal of RBS
Aviation Capital in Q2 2012 contributed c.£5 billion of this reduction.
Risk-weighted assets were £33 billion lower, principally driven by
disposals, run-off and restructuring of existing positions.
An operating loss of £2,879 million was £1,340 million lower than 2011,
principally due to lower impairments and expenses, partially offset by
lower net interest income following run-off and disposals.
Impairment losses fell by £1,694 million to £2,223 million, with £1,366
million of this reduction from the Ulster Bank portfolio and £269 million
from the real estate portfolio.
Income declined by £686 million as continued divestment and run-off
reduced net interest income. Rental income was lower following the
disposal of RBS Aviation Capital in Q2 2012.
Expenses were £332 million lower, driven by reduced headcount and
lower operating lease depreciation, principally following the disposal of
RBS Aviation Capital.
Headcount declined by 29% to 2,900 reflecting the divestment activity
and run-off across the business.