RBS 2013 Annual Report Download - page 314
Download and view the complete annual report
Please find page 314 of the 2013 RBS annual report below. You can navigate through the pages in the report by either clicking on the pages listed below, or by using the keyword search tool below to find specific information within the annual report.-
 1
1 -
2
-
3
-
4
-
5
-
6
-
7
-
8
-
9
-
10
-
11
-
12
-
13
-
14
-
15
-
16
-
17
-
18
-
19
-
20
-
21
-
22
-
23
-
24
-
25
-
26
-
27
-
28
-
29
-
30
-
31
-
32
-
33
-
34
-
35
-
36
-
37
-
38
-
39
-
40
-
41
-
42
-
43
-
44
-
45
-
46
-
47
-
48
-
49
-
50
-
51
-
52
-
53
-
54
-
55
-
56
-
57
-
58
-
59
-
60
-
61
-
62
-
63
-
64
-
65
-
66
-
67
-
68
-
69
-
70
-
71
-
72
-
73
-
74
-
75
-
76
-
77
-
78
-
79
-
80
-
81
-
82
-
83
-
84
-
85
-
86
-
87
-
88
-
89
-
90
-
91
-
92
-
93
-
94
-
95
-
96
-
97
-
98
-
99
-
100
-
101
-
102
-
103
-
104
-
105
-
106
-
107
-
108
-
109
-
110
-
111
-
112
-
113
-
114
-
115
-
116
-
117
-
118
-
119
-
120
-
121
-
122
-
123
-
124
-
125
-
126
-
127
-
128
-
129
-
130
-
131
-
132
-
133
-
134
-
135
-
136
-
137
-
138
-
139
-
140
-
141
-
142
-
143
-
144
-
145
-
146
-
147
-
148
-
149
-
150
-
151
-
152
-
153
-
154
-
155
-
156
-
157
-
158
-
159
-
160
-
161
-
162
-
163
-
164
-
165
-
166
-
167
-
168
-
169
-
170
-
171
-
172
-
173
-
174
-
175
-
176
-
177
-
178
-
179
-
180
-
181
-
182
-
183
-
184
-
185
-
186
-
187
-
188
-
189
-
190
-
191
-
192
-
193
-
194
-
195
-
196
-
197
-
198
-
199
-
200
-
201
-
202
-
203
-
204
-
205
-
206
-
207
-
208
-
209
-
210
-
211
-
212
-
213
-
214
-
215
-
216
-
217
-
218
-
219
-
220
-
221
-
222
-
223
-
224
-
225
-
226
-
227
-
228
-
229
-
230
-
231
-
232
-
233
-
234
-
235
-
236
-
237
-
238
-
239
-
240
-
241
-
242
-
243
-
244
-
245
-
246
-
247
-
248
-
249
-
250
-
251
-
252
-
253
-
254
-
255
-
256
-
257
-
258
-
259
-
260
-
261
-
262
-
263
-
264
-
265
-
266
-
267
-
268
-
269
-
270
-
271
-
272
-
273
-
274
-
275
-
276
-
277
-
278
-
279
-
280
-
281
-
282
-
283
-
284
-
285
-
286
-
287
-
288
-
289
-
290
-
291
-
292
-
293
-
294
-
295
-
296
-
297
-
298
-
299
-
300
-
301
-
302
-
303
-
 304
304 -
 305
305 -
 306
306 -
 307
307 -
 308
308 -
 309
309 -
 310
310 -
 311
311 -
 312
312 -
 313
313 -
 314
314 -
 315
315 -
 316
316 -
 317
317 -
 318
318 -
 319
319 -
 320
320 -
 321
321 -
 322
322 -
 323
323 -
 324
324 -
325
-
326
-
327
-
328
-
329
-
330
-
331
-
332
-
333
-
334
-
335
-
336
-
337
-
338
-
339
-
340
-
341
-
342
-
343
-
344
-
345
-
346
-
347
-
348
-
349
-
350
-
351
-
352
-
353
-
354
-
355
-
356
-
357
-
358
-
359
-
360
-
361
-
362
-
363
-
364
-
365
-
366
-
367
-
368
-
369
-
370
-
371
-
372
-
373
-
374
-
375
-
376
-
377
-
378
-
379
-
380
-
381
-
382
-
383
-
384
-
385
-
386
-
387
-
388
-
389
-
390
-
391
-
392
-
393
-
394
-
395
-
396
-
397
-
398
-
399
-
400
-
401
-
402
-
403
-
404
-
405
-
406
-
407
-
408
-
409
-
410
-
411
-
412
-
413
-
414
-
415
-
416
-
417
-
418
-
419
-
420
-
421
-
422
-
423
-
424
-
425
-
426
-
427
-
428
-
429
-
430
-
431
-
432
-
433
-
434
-
435
-
436
-
437
-
438
-
439
-
440
-
441
-
442
-
443
-
444
-
445
-
446
-
447
-
448
-
449
-
450
-
451
-
452
-
453
-
454
-
455
-
456
-
457
-
458
-
459
-
460
-
461
-
462
-
463
-
464
-
465
-
466
-
467
-
468
-
469
-
470
-
471
-
472
-
473
-
474
-
475
-
476
-
477
-
478
-
479
-
480
-
481
-
482
-
483
-
484
-
485
-
486
-
487
-
488
-
489
-
490
-
491
-
492
-
493
-
494
-
495
-
496
-
497
-
498
-
499
-
500
-
501
-
502
-
503
-
504
-
505
-
506
-
507
-
508
-
509
-
510
-
511
-
512
-
513
-
514
-
515
-
516
-
517
-
518
-
519
-
520
-
521
-
522
-
523
-
524
-
525
-
526
-
527
-
528
-
529
-
530
-
531
-
532
-
533
-
534
-
535
-
536
-
537
-
538
-
539
-
540
-
541
-
542
-
543
-
544
-
545
-
546
-
547
-
548
-
549
-
550
-
551
-
552
-
553
-
554
-
555
-
556
-
557
-
558
-
559
-
560
-
561
-
562
-
563
-
564
 |
 |

Business review Risk and balance sheet management
312
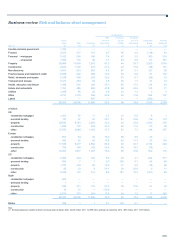
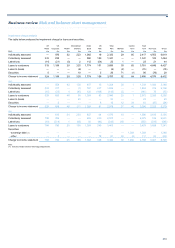
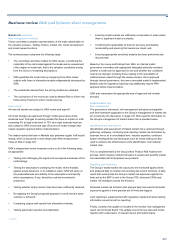
Balance sheet analysis continued
REIL, provisions and AFS reserves continued
Potential problem loans
Potential problem loans (PPL) are loans for which an impairment event has taken place but no impairment loss is expected. This category is used for
advances which are not past due 90 days or revolving credit facilities where identification as 90 days overdue is not feasible.
2013 2012 2011
£m £m £m
Potential problem loans 789 807 739
Both REIL and PPL are reported gross and take no account of the value of any security held which could reduce the eventual loss should it occur, nor of
any provision marked. Therefore impaired assets which are highly collateralised, such as mortgages, will have a low coverage ratio of provisions held
against the reported impaired balance.
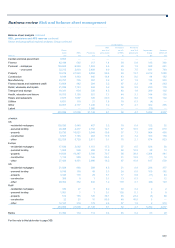
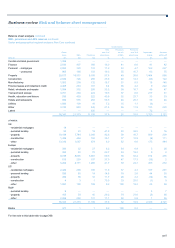
Past due analysis
The table below shows loans and advances to customers that were past due at the balance sheet date but are not considered impaired.
2013 2012 2011
Core Non-Core Total Core Non-Core Total Core Non-Core Total
£m £m £m £m £m £m £m £m £m
Past due 1-29 days 4,587 178 4,765 5,349 250 5,599 5,722 724 6,446
Past due 30-59 days 1,212 48 1,260 1,062 55 1,117 1,556 171 1,727
Past due 60-89 days 792 30 822 1,151 26 1,177 975 107 1,082
Past due 90 days or more 1,945 276 2,221 2,215 426 2,641 1,794 542 2,336
8,536 532 9,068 9,777 757 10,534 10,047 1,544 11,591
Past due analysis by sector*
Personal 4,982 190 5,172 5,198 303 5,501 6,819 741 7,560
Property and construction 1,075 298 1,373 1,475 388 1,863 1,126 651 1,777
Financial institution 366 2 368 92 11 103 83 6 89
Other corporate 2,113 42 2,155 3,012 55 3,067 2,019 146 2,165
8,536 532 9,068 9,777 757 10,534 10,047 1,544 11,591
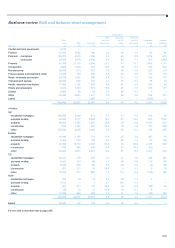
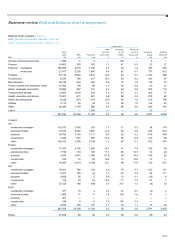
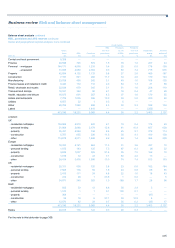
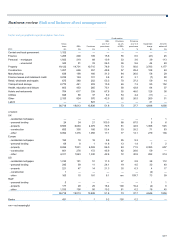
Impairment provisions flow statement
The movement in loan impairment provisions by division is shown in the table below.
UK UK International Ulster US Total Central Total
Retail Corporate Wealth Banking Bank R&C (1) R&C (1) Markets items Core Non-Core Group
£m £m £m £m £m £m £m £m £m £m £m £m
A
t 1 January 2013 2,629 2,432 109 391 3,910 285 9,756 305 1 10,062 11,200 21,262
Currency translation
and other adjustments 1 8 — (15) 51 31 76 5 — 81 28 109
Disposal of subsidiaries — — — — — — — — — — (77) (77)
A
mounts written-off (815) (772) (15) (281) (277) (284) (2,444) (46) — (2,490) (1,856) (4,346)
Recoveries of amounts
previously written-off 46 15 — 15 1 89 166 2 — 168 88 256
Charged to income statement
- continuing operations 319 1,188 29 219 1,774 151 3,680 21 65 3,766 4,646 8,412
Unwind of discount (2) (74) (38) (3) (4) (81) — (200) (1) — (201) (190) (391)
A
t 31 December 2013 2,106 2,833 120 325 5,378 272 11,034 286 66 11,386 13,839 25,225
Individually assessed
- banks — — — 1 — — 1 61 — 62 1 63
- customers — 1,462 109 207 2,078 60 3,916 214 66 4,196 12,650 16,846
Collectively assessed 1,929 1,096 — — 2,596 118 5,739 — — 5,739 565 6,304
Latent 177 275 11 117 704 94 1,378 11 — 1,389 623 2,012
2,106 2,833 120 325 5,378 272 11,034 286 66 11,386 13,839 25,225
For the notes to this table refer to page 314.
*unaudited