RBS 2013 Annual Report Download - page 341
Download and view the complete annual report
Please find page 341 of the 2013 RBS annual report below. You can navigate through the pages in the report by either clicking on the pages listed below, or by using the keyword search tool below to find specific information within the annual report.-
 1
1 -
2
-
3
-
4
-
5
-
6
-
7
-
8
-
9
-
10
-
11
-
12
-
13
-
14
-
15
-
16
-
17
-
18
-
19
-
20
-
21
-
22
-
23
-
24
-
25
-
26
-
27
-
28
-
29
-
30
-
31
-
32
-
33
-
34
-
35
-
36
-
37
-
38
-
39
-
40
-
41
-
42
-
43
-
44
-
45
-
46
-
47
-
48
-
49
-
50
-
51
-
52
-
53
-
54
-
55
-
56
-
57
-
58
-
59
-
60
-
61
-
62
-
63
-
64
-
65
-
66
-
67
-
68
-
69
-
70
-
71
-
72
-
73
-
74
-
75
-
76
-
77
-
78
-
79
-
80
-
81
-
82
-
83
-
84
-
85
-
86
-
87
-
88
-
89
-
90
-
91
-
92
-
93
-
94
-
95
-
96
-
97
-
98
-
99
-
100
-
101
-
102
-
103
-
104
-
105
-
106
-
107
-
108
-
109
-
110
-
111
-
112
-
113
-
114
-
115
-
116
-
117
-
118
-
119
-
120
-
121
-
122
-
123
-
124
-
125
-
126
-
127
-
128
-
129
-
130
-
131
-
132
-
133
-
134
-
135
-
136
-
137
-
138
-
139
-
140
-
141
-
142
-
143
-
144
-
145
-
146
-
147
-
148
-
149
-
150
-
151
-
152
-
153
-
154
-
155
-
156
-
157
-
158
-
159
-
160
-
161
-
162
-
163
-
164
-
165
-
166
-
167
-
168
-
169
-
170
-
171
-
172
-
173
-
174
-
175
-
176
-
177
-
178
-
179
-
180
-
181
-
182
-
183
-
184
-
185
-
186
-
187
-
188
-
189
-
190
-
191
-
192
-
193
-
194
-
195
-
196
-
197
-
198
-
199
-
200
-
201
-
202
-
203
-
204
-
205
-
206
-
207
-
208
-
209
-
210
-
211
-
212
-
213
-
214
-
215
-
216
-
217
-
218
-
219
-
220
-
221
-
222
-
223
-
224
-
225
-
226
-
227
-
228
-
229
-
230
-
231
-
232
-
233
-
234
-
235
-
236
-
237
-
238
-
239
-
240
-
241
-
242
-
243
-
244
-
245
-
246
-
247
-
248
-
249
-
250
-
251
-
252
-
253
-
254
-
255
-
256
-
257
-
258
-
259
-
260
-
261
-
262
-
263
-
264
-
265
-
266
-
267
-
268
-
269
-
270
-
271
-
272
-
273
-
274
-
275
-
276
-
277
-
278
-
279
-
280
-
281
-
282
-
283
-
284
-
285
-
286
-
287
-
288
-
289
-
290
-
291
-
292
-
293
-
294
-
295
-
296
-
297
-
298
-
299
-
300
-
301
-
302
-
303
-
304
-
305
-
306
-
307
-
308
-
309
-
310
-
311
-
312
-
313
-
314
-
315
-
316
-
317
-
318
-
319
-
320
-
321
-
322
-
323
-
324
-
325
-
326
-
327
-
328
-
329
-
330
-
 331
331 -
 332
332 -
 333
333 -
 334
334 -
 335
335 -
 336
336 -
 337
337 -
 338
338 -
 339
339 -
 340
340 -
 341
341 -
 342
342 -
 343
343 -
 344
344 -
 345
345 -
 346
346 -
 347
347 -
 348
348 -
 349
349 -
 350
350 -
 351
351 -
352
-
353
-
354
-
355
-
356
-
357
-
358
-
359
-
360
-
361
-
362
-
363
-
364
-
365
-
366
-
367
-
368
-
369
-
370
-
371
-
372
-
373
-
374
-
375
-
376
-
377
-
378
-
379
-
380
-
381
-
382
-
383
-
384
-
385
-
386
-
387
-
388
-
389
-
390
-
391
-
392
-
393
-
394
-
395
-
396
-
397
-
398
-
399
-
400
-
401
-
402
-
403
-
404
-
405
-
406
-
407
-
408
-
409
-
410
-
411
-
412
-
413
-
414
-
415
-
416
-
417
-
418
-
419
-
420
-
421
-
422
-
423
-
424
-
425
-
426
-
427
-
428
-
429
-
430
-
431
-
432
-
433
-
434
-
435
-
436
-
437
-
438
-
439
-
440
-
441
-
442
-
443
-
444
-
445
-
446
-
447
-
448
-
449
-
450
-
451
-
452
-
453
-
454
-
455
-
456
-
457
-
458
-
459
-
460
-
461
-
462
-
463
-
464
-
465
-
466
-
467
-
468
-
469
-
470
-
471
-
472
-
473
-
474
-
475
-
476
-
477
-
478
-
479
-
480
-
481
-
482
-
483
-
484
-
485
-
486
-
487
-
488
-
489
-
490
-
491
-
492
-
493
-
494
-
495
-
496
-
497
-
498
-
499
-
500
-
501
-
502
-
503
-
504
-
505
-
506
-
507
-
508
-
509
-
510
-
511
-
512
-
513
-
514
-
515
-
516
-
517
-
518
-
519
-
520
-
521
-
522
-
523
-
524
-
525
-
526
-
527
-
528
-
529
-
530
-
531
-
532
-
533
-
534
-
535
-
536
-
537
-
538
-
539
-
540
-
541
-
542
-
543
-
544
-
545
-
546
-
547
-
548
-
549
-
550
-
551
-
552
-
553
-
554
-
555
-
556
-
557
-
558
-
559
-
560
-
561
-
562
-
563
-
564
 |
 |

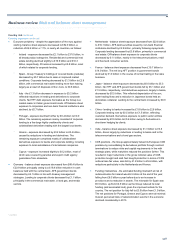
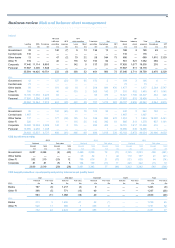
Business review Risk and balance sheet management
339
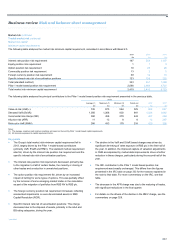
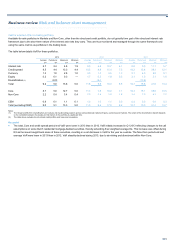
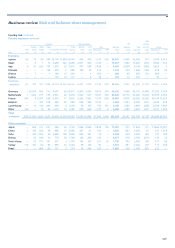
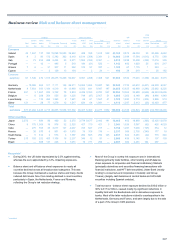
VaR for selected AFS non-trading portfolios
Available-for-sale portfolios in Markets and Non-Core, other than the structured credit portfolio, do not typically form part of the structural interest rate
framework due to the short-term nature of the interest rate risks they carry. They are thus monitored and managed through the same framework and
using the same metrics as portfolios in the trading book.
The table below details VaR for these portfolios.
2013 2012 2011
Average Period end Maximum Minimum Average Period end Maximum Minimum Average Period end Maximum Minimum
£m £m £m £m £m £m £m £m £m £m £m £m
Interest rate 2.7 2.4 4.8 1.9 6.9 4.5 10.7 4.1 8.8 9.9 11.1 5.7
Credit spread 8.5 4.4 13.3 4.4 10.5 8.8 15.4 7.3 18.2 13.6 39.3 12.1
Currency 1.3 1.0 2.8 1.0 3.0 1.3 4.5 1.3 2.1 4.0 5.9 0.1
Equity 0.2 0.1 0.3 — 1.7 0.3 1.9 0.3 2.1 1.9 3.1 1.6
Diversification (1) (2.9) (5.4) (13.6)
Total 9.2 5.0 13.6 5.0 11.8 9.5 18.3 8.5 19.7 15.8 41.6 13.4
Core 8.7 5.0 12.7 5.0 11.3 7.5 19.0 7.1 19.3 15.1 38.9 13.5
Non-Core 2.2 0.4 3.4 0.4 2.5 3.4 3.6 1.6 3.4 2.5 4.3 2.2
CEM 0.8 0.1 1.1 0.1 1.0 1.0 1.1 0.9 0.4 0.9 0.9 0.3
Total (excluding CEM) 9.0 5.1 13.3 5.0 11.5 9.4 17.8 8.2 19.7 15.5 41.4 13.7
Notes:
(1) The Group benefits from diversification as it reduces risk by allocating positions across various financial instrument types, currencies and markets. The extent of the diversification benefit depends
on the correlation between the assets and risk factors in the portfolio at a particular time.
(2) The table above excludes the structured credit portfolio and loans and receivables.
Key point
• The total, Core and credit spread period end VaR were lower in 2013 than in 2012. VaR initially increased in Q1 2013 reflecting changes to the call
assumptions on some Dutch residential mortgage-backed securities, thereby extending their weighted average life. This increase was offset during
Q3 as the issuer bought back some of these securities, resulting in a net decrease in VaR for the year as a whole. The Non-Core period end and
average VaR were lower in 2013 than in 2012. VaR steadily declined during 2013, due to de-risking and divestment within Non-Core.