RBS 2013 Annual Report Download - page 208
Download and view the complete annual report
Please find page 208 of the 2013 RBS annual report below. You can navigate through the pages in the report by either clicking on the pages listed below, or by using the keyword search tool below to find specific information within the annual report.-
 1
1 -
2
-
3
-
4
-
5
-
6
-
7
-
8
-
9
-
10
-
11
-
12
-
13
-
14
-
15
-
16
-
17
-
18
-
19
-
20
-
21
-
22
-
23
-
24
-
25
-
26
-
27
-
28
-
29
-
30
-
31
-
32
-
33
-
34
-
35
-
36
-
37
-
38
-
39
-
40
-
41
-
42
-
43
-
44
-
45
-
46
-
47
-
48
-
49
-
50
-
51
-
52
-
53
-
54
-
55
-
56
-
57
-
58
-
59
-
60
-
61
-
62
-
63
-
64
-
65
-
66
-
67
-
68
-
69
-
70
-
71
-
72
-
73
-
74
-
75
-
76
-
77
-
78
-
79
-
80
-
81
-
82
-
83
-
84
-
85
-
86
-
87
-
88
-
89
-
90
-
91
-
92
-
93
-
94
-
95
-
96
-
97
-
98
-
99
-
100
-
101
-
102
-
103
-
104
-
105
-
106
-
107
-
108
-
109
-
110
-
111
-
112
-
113
-
114
-
115
-
116
-
117
-
118
-
119
-
120
-
121
-
122
-
123
-
124
-
125
-
126
-
127
-
128
-
129
-
130
-
131
-
132
-
133
-
134
-
135
-
136
-
137
-
138
-
139
-
140
-
141
-
142
-
143
-
144
-
145
-
146
-
147
-
148
-
149
-
150
-
151
-
152
-
153
-
154
-
155
-
156
-
157
-
158
-
159
-
160
-
161
-
162
-
163
-
164
-
165
-
166
-
167
-
168
-
169
-
170
-
171
-
172
-
173
-
174
-
175
-
176
-
177
-
178
-
179
-
180
-
181
-
182
-
183
-
184
-
185
-
186
-
187
-
188
-
189
-
190
-
191
-
192
-
193
-
194
-
195
-
196
-
197
-
 198
198 -
 199
199 -
 200
200 -
 201
201 -
 202
202 -
 203
203 -
 204
204 -
 205
205 -
 206
206 -
 207
207 -
 208
208 -
 209
209 -
 210
210 -
 211
211 -
 212
212 -
 213
213 -
 214
214 -
 215
215 -
 216
216 -
 217
217 -
 218
218 -
219
-
220
-
221
-
222
-
223
-
224
-
225
-
226
-
227
-
228
-
229
-
230
-
231
-
232
-
233
-
234
-
235
-
236
-
237
-
238
-
239
-
240
-
241
-
242
-
243
-
244
-
245
-
246
-
247
-
248
-
249
-
250
-
251
-
252
-
253
-
254
-
255
-
256
-
257
-
258
-
259
-
260
-
261
-
262
-
263
-
264
-
265
-
266
-
267
-
268
-
269
-
270
-
271
-
272
-
273
-
274
-
275
-
276
-
277
-
278
-
279
-
280
-
281
-
282
-
283
-
284
-
285
-
286
-
287
-
288
-
289
-
290
-
291
-
292
-
293
-
294
-
295
-
296
-
297
-
298
-
299
-
300
-
301
-
302
-
303
-
304
-
305
-
306
-
307
-
308
-
309
-
310
-
311
-
312
-
313
-
314
-
315
-
316
-
317
-
318
-
319
-
320
-
321
-
322
-
323
-
324
-
325
-
326
-
327
-
328
-
329
-
330
-
331
-
332
-
333
-
334
-
335
-
336
-
337
-
338
-
339
-
340
-
341
-
342
-
343
-
344
-
345
-
346
-
347
-
348
-
349
-
350
-
351
-
352
-
353
-
354
-
355
-
356
-
357
-
358
-
359
-
360
-
361
-
362
-
363
-
364
-
365
-
366
-
367
-
368
-
369
-
370
-
371
-
372
-
373
-
374
-
375
-
376
-
377
-
378
-
379
-
380
-
381
-
382
-
383
-
384
-
385
-
386
-
387
-
388
-
389
-
390
-
391
-
392
-
393
-
394
-
395
-
396
-
397
-
398
-
399
-
400
-
401
-
402
-
403
-
404
-
405
-
406
-
407
-
408
-
409
-
410
-
411
-
412
-
413
-
414
-
415
-
416
-
417
-
418
-
419
-
420
-
421
-
422
-
423
-
424
-
425
-
426
-
427
-
428
-
429
-
430
-
431
-
432
-
433
-
434
-
435
-
436
-
437
-
438
-
439
-
440
-
441
-
442
-
443
-
444
-
445
-
446
-
447
-
448
-
449
-
450
-
451
-
452
-
453
-
454
-
455
-
456
-
457
-
458
-
459
-
460
-
461
-
462
-
463
-
464
-
465
-
466
-
467
-
468
-
469
-
470
-
471
-
472
-
473
-
474
-
475
-
476
-
477
-
478
-
479
-
480
-
481
-
482
-
483
-
484
-
485
-
486
-
487
-
488
-
489
-
490
-
491
-
492
-
493
-
494
-
495
-
496
-
497
-
498
-
499
-
500
-
501
-
502
-
503
-
504
-
505
-
506
-
507
-
508
-
509
-
510
-
511
-
512
-
513
-
514
-
515
-
516
-
517
-
518
-
519
-
520
-
521
-
522
-
523
-
524
-
525
-
526
-
527
-
528
-
529
-
530
-
531
-
532
-
533
-
534
-
535
-
536
-
537
-
538
-
539
-
540
-
541
-
542
-
543
-
544
-
545
-
546
-
547
-
548
-
549
-
550
-
551
-
552
-
553
-
554
-
555
-
556
-
557
-
558
-
559
-
560
-
561
-
562
-
563
-
564
 |
 |

Business review Risk and balance sheet management
206
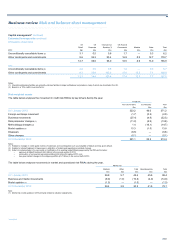
Capital management* continued
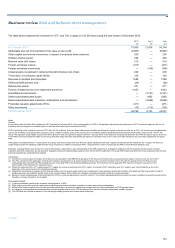
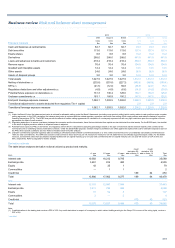
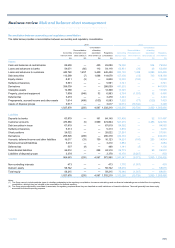
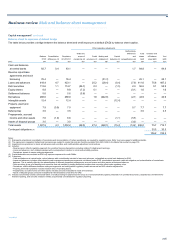
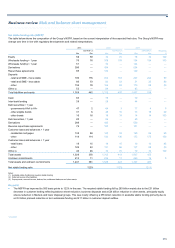
Balance sheet to exposure at default bridge
The table below provides a bridge between the balance sheet and credit exposure at default (EAD) by balance sheet caption.
Other regulatory adjustments
Methodology
Within the differences Total Undrawn and
BalanceConsolidation Regulatory scope of Credit Netting and Capital and drawn off-balance Total
sheet differences (1) consolidationmarket risk (2) provisions (3) collateral (4) deduction (5) reclassifications (6) EAD sheet EAD EAD
2013 £bn £bn £bn £bn £bn £bn £bn £bn £bn £bn £bn
Cash and balances
at central banks 82.7 0.4 83.1 — — — — 1.7 84.8 — 84.8
Reverse repurchase
agreements and stock
borrowing 76.4 — 76.4 — — (51.3) — — 25.1 — 25.1
Loans and advances 418.4 4.7 423.1 — 25.2 (28.4) (0.4) (7.9) 411.6 75.6 487.2
Debt securities 113.6 1.1 114.7 (56.7) 0.3 — (1.5) 2.0 58.8 0.1 58.9
Equity shares 8.8 — 8.8 (7.2) 0.1 — — (0.1) 1.6 — 1.6
Settlement balances 5.6 — 5.6 (5.6) — — — — — — —
Derivatives 288.0 — 288.0 — 1.8 (242.8) — (2.1) 44.9 — 44.9
Intangible assets 12.4 — 12.4 — — — (12.4) — — — —
Property, plant and
equipment 7.9 (0.9) 7.0 — — — — 0.7 7.7 — 7.7
Deferred tax 3.5 — 3.5 — — — — — 3.5 — 3.5
Prepayments, accrued
income and other assets 7.6 (1.0) 6.6 — — — (1.1) (5.5) — — —
A
ssets of disposal groups 3.0 — 3.0 — — — — (3.0) — — —
Total assets 1,027.9 4.3 1,032.2 (69.5) 27.4 (322.5) (15.4) (14.2) 638.0 75.7 713.7
Contingent obligations (7) 30.5 30.5
106.2 744.2
Notes:
(1) Represents proportional consolidation of associates and deconsolidation of certain subsidiaries, as required by regulatory rules. Refer to previous page for additional details.
(2) The exposures in regulatory trading book businesses are subject to market risk and are therefore excluded from EAD. Refer to the Market risk section on page 318.
(3) Impairment loss provisions on loans and advances and securities, and credit valuation adjustment on derivatives.
(4) Includes:
- Reverse repos: reflects regulatory approach for securities financing transactions including netting of collateral and cash legs.
- Loans and advances: cash collateral pledged with counterparties in relation to net derivative liability positions.
- Derivatives: impact of master netting arrangements.
(5) Capital deductions are excluded as EAD only captures exposures for credit RWAs.
(6) Comprises:
- Cash and balances at central banks: notice balances with central banks included in loans and advances, reclassified as central bank balances for EAD.
- Loans and advances: includes offset related to cash management pooling arrangements not allowed under IFRS, standardised approach credit risk mitigation and reclassification of central bank
balances. This is partially offset by the reclassification of disposal groups and prepayments, accrued income and other assets as customer balances.
- Debt securities: gross up of banking book securities that are matched by trading book short positions that cannot be offset under regulatory rules.
- Derivatives: reflects difference between netting arrangements and netting within regulatory model sets as well as EAD valuation adjustments.
- Property, plant and equipment: includes residual value of operating leases.
- Prepayments, accrued income and other assets: includes amounts reclassified to loans and advances.
- Assets of disposal groups: amounts reclassified to relevant balance sheet lines for EAD.
(7) Includes documentary credits (commercial letters of credit providing for payment by the Group to a named beneficiary against presentation of specified documents), classified as commitments for
financial reporting, and amounts related to entities proportionally consolidated for regulatory reporting.
*unaudited