RBS 2013 Annual Report Download - page 346
Download and view the complete annual report
Please find page 346 of the 2013 RBS annual report below. You can navigate through the pages in the report by either clicking on the pages listed below, or by using the keyword search tool below to find specific information within the annual report.-
 1
1 -
2
-
3
-
4
-
5
-
6
-
7
-
8
-
9
-
10
-
11
-
12
-
13
-
14
-
15
-
16
-
17
-
18
-
19
-
20
-
21
-
22
-
23
-
24
-
25
-
26
-
27
-
28
-
29
-
30
-
31
-
32
-
33
-
34
-
35
-
36
-
37
-
38
-
39
-
40
-
41
-
42
-
43
-
44
-
45
-
46
-
47
-
48
-
49
-
50
-
51
-
52
-
53
-
54
-
55
-
56
-
57
-
58
-
59
-
60
-
61
-
62
-
63
-
64
-
65
-
66
-
67
-
68
-
69
-
70
-
71
-
72
-
73
-
74
-
75
-
76
-
77
-
78
-
79
-
80
-
81
-
82
-
83
-
84
-
85
-
86
-
87
-
88
-
89
-
90
-
91
-
92
-
93
-
94
-
95
-
96
-
97
-
98
-
99
-
100
-
101
-
102
-
103
-
104
-
105
-
106
-
107
-
108
-
109
-
110
-
111
-
112
-
113
-
114
-
115
-
116
-
117
-
118
-
119
-
120
-
121
-
122
-
123
-
124
-
125
-
126
-
127
-
128
-
129
-
130
-
131
-
132
-
133
-
134
-
135
-
136
-
137
-
138
-
139
-
140
-
141
-
142
-
143
-
144
-
145
-
146
-
147
-
148
-
149
-
150
-
151
-
152
-
153
-
154
-
155
-
156
-
157
-
158
-
159
-
160
-
161
-
162
-
163
-
164
-
165
-
166
-
167
-
168
-
169
-
170
-
171
-
172
-
173
-
174
-
175
-
176
-
177
-
178
-
179
-
180
-
181
-
182
-
183
-
184
-
185
-
186
-
187
-
188
-
189
-
190
-
191
-
192
-
193
-
194
-
195
-
196
-
197
-
198
-
199
-
200
-
201
-
202
-
203
-
204
-
205
-
206
-
207
-
208
-
209
-
210
-
211
-
212
-
213
-
214
-
215
-
216
-
217
-
218
-
219
-
220
-
221
-
222
-
223
-
224
-
225
-
226
-
227
-
228
-
229
-
230
-
231
-
232
-
233
-
234
-
235
-
236
-
237
-
238
-
239
-
240
-
241
-
242
-
243
-
244
-
245
-
246
-
247
-
248
-
249
-
250
-
251
-
252
-
253
-
254
-
255
-
256
-
257
-
258
-
259
-
260
-
261
-
262
-
263
-
264
-
265
-
266
-
267
-
268
-
269
-
270
-
271
-
272
-
273
-
274
-
275
-
276
-
277
-
278
-
279
-
280
-
281
-
282
-
283
-
284
-
285
-
286
-
287
-
288
-
289
-
290
-
291
-
292
-
293
-
294
-
295
-
296
-
297
-
298
-
299
-
300
-
301
-
302
-
303
-
304
-
305
-
306
-
307
-
308
-
309
-
310
-
311
-
312
-
313
-
314
-
315
-
316
-
317
-
318
-
319
-
320
-
321
-
322
-
323
-
324
-
325
-
326
-
327
-
328
-
329
-
330
-
331
-
332
-
333
-
334
-
335
-
 336
336 -
 337
337 -
 338
338 -
 339
339 -
 340
340 -
 341
341 -
 342
342 -
 343
343 -
 344
344 -
 345
345 -
 346
346 -
 347
347 -
 348
348 -
 349
349 -
 350
350 -
 351
351 -
 352
352 -
 353
353 -
 354
354 -
 355
355 -
 356
356 -
357
-
358
-
359
-
360
-
361
-
362
-
363
-
364
-
365
-
366
-
367
-
368
-
369
-
370
-
371
-
372
-
373
-
374
-
375
-
376
-
377
-
378
-
379
-
380
-
381
-
382
-
383
-
384
-
385
-
386
-
387
-
388
-
389
-
390
-
391
-
392
-
393
-
394
-
395
-
396
-
397
-
398
-
399
-
400
-
401
-
402
-
403
-
404
-
405
-
406
-
407
-
408
-
409
-
410
-
411
-
412
-
413
-
414
-
415
-
416
-
417
-
418
-
419
-
420
-
421
-
422
-
423
-
424
-
425
-
426
-
427
-
428
-
429
-
430
-
431
-
432
-
433
-
434
-
435
-
436
-
437
-
438
-
439
-
440
-
441
-
442
-
443
-
444
-
445
-
446
-
447
-
448
-
449
-
450
-
451
-
452
-
453
-
454
-
455
-
456
-
457
-
458
-
459
-
460
-
461
-
462
-
463
-
464
-
465
-
466
-
467
-
468
-
469
-
470
-
471
-
472
-
473
-
474
-
475
-
476
-
477
-
478
-
479
-
480
-
481
-
482
-
483
-
484
-
485
-
486
-
487
-
488
-
489
-
490
-
491
-
492
-
493
-
494
-
495
-
496
-
497
-
498
-
499
-
500
-
501
-
502
-
503
-
504
-
505
-
506
-
507
-
508
-
509
-
510
-
511
-
512
-
513
-
514
-
515
-
516
-
517
-
518
-
519
-
520
-
521
-
522
-
523
-
524
-
525
-
526
-
527
-
528
-
529
-
530
-
531
-
532
-
533
-
534
-
535
-
536
-
537
-
538
-
539
-
540
-
541
-
542
-
543
-
544
-
545
-
546
-
547
-
548
-
549
-
550
-
551
-
552
-
553
-
554
-
555
-
556
-
557
-
558
-
559
-
560
-
561
-
562
-
563
-
564
 |
 |

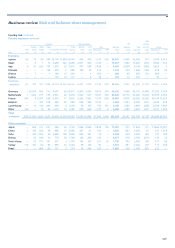
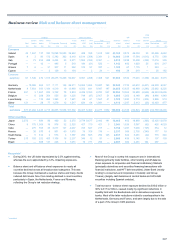
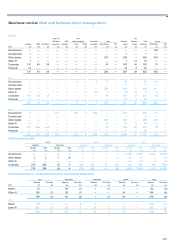
Business review Risk and balance sheet management
344
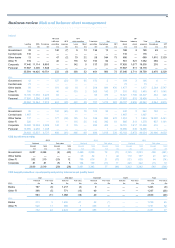
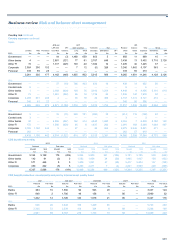
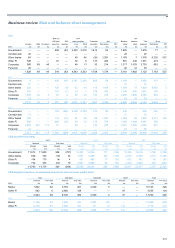
Country risk continued
Basis of reporting
The tables in this section show the Group’s exposure at 31 December
2013, 2012 and 2011. The numbers are reported by country of operation
of the obligor, except exposures to governments and individuals which
are shown by country of residence.
The country of operation is the country where the main operating assets
of a legal entity are held, or where its main cash flows are generated,
taking account of the entity’s dependency on subsidiaries' activities.
Previously, exposures in this section were reported by country of
incorporation. The new basis provides a better reflection of the country
risks taken by the Group and is more in line with internal risk
management. Prior years’ information has been revised.
Countries shown are those which had ratings of A+ or below from
Standard and Poor’s, Moody’s or Fitch at 31 December 2013, where the
Group’s balance sheet exposure (as defined in this section) to
counterparties operating (or individuals residing) in them exceeded £1.0
billion. Also included are selected eurozone countries.
The exposures are stated before taking into account risk mitigants such
as guarantees, insurance or collateral (with the exception of reverse
repos) which may have been put in place to reduce or eliminate exposure
to country risk events. The tables do separately show the Group’s CDS
positions, as the Group may be either a net buyer or a net seller of
protection. The CDS positions for 2013 and 2012 are by country of
operation, those for 2011 are by country of incorporation.
Exposures relating to ocean-going vessels are not included as they
cannot be meaningfully assigned to specific countries from a country risk
perspective.
Definitions
Lending - Comprises gross loans and advances, including cash balances
and risk elements in lending (REIL - refer to page 554 for definition).
Debt securities - Comprise securities classified as available-for-sale
(AFS), loans and receivables (LAR), held-for-trading (HFT) and
designated as at fair value through profit or loss (DFV). All debt securities
other than LAR securities are carried at fair value. LAR debt securities
are carried at amortised cost less impairment. HFT debt securities are
presented as gross long positions (including DFV securities) and short
positions per country. Impairment losses and exchange differences
relating to AFS debt securities, together with interest, are recognised in
the income statement. Other changes in the fair value of AFS securities
are reported in AFS reserves, which are presented gross of tax.
Derivatives (net) - Comprise the mark-to-market (mtm) value of such
contracts after the effect of legally enforceable netting agreements in line
with the corresponding regulatory capital models, but before the effect of
collateral.
Securities financing transactions (SFT) (net) - Comprise the mtm value of
the cash and securities that are due to the Group at a future date under
repurchase agreements, reverse repurchase agreements, stock
borrowing, stock lending and equity financing transactions, after the effect
of collateral intrinsic to the transaction and legally enforceable netting
agreements. Counterparty netting is applied as per the corresponding
regulatory capital approach. Additional collateral called to offset mtm
positions (variation margin) is not included.
In addition and as memorandum items, the tables show derivatives gross
of netting, and SFT gross of netting and collateral intrinsic to the
transaction.
Balance sheet - Comprises lending, debt securities, derivatives (net) and
SFT (net) exposures, as defined above.
Off-balance sheet - Comprises letters of credit, guarantees, other
contingent obligations and legally committed undrawn facilities.
Total - Comprises balance sheet and off-balance sheet exposure, as
defined above.
Credit default swaps (CDSs) - Under a CDS contract, the credit risk on
the reference entity is transferred from the buyer to the seller. The
column ‘fair value’ (or ‘mtm value’) represents the balance sheet carrying
value of the resulting exposure. The mtm value of CDSs is included in
derivatives against the counterparty of the trade, as opposed to the
reference entity. The notional is the par value of the credit protection
bought or sold and is included against the reference entity of the CDS
contract.
The column ‘CDS notional less fair value’ represents the net effect on
exposure should the CDS contracts be triggered by a credit event,
assuming a zero recovery rate on the reference exposure. This net effect
would be the increase in exposure arising from sold positions netted
against the decrease arising from bought positions. For a sold position,
the change in exposure equals the notional less the fair value amount;
this represents the amount the Group would owe to its CDS
counterparties if the reference entity defaulted. Positive recovery rates
would tend to reduce the gross components (increases and decreases) of
those numbers.
Exposures relating to credit derivative product companies and related
hedges as well as Nth-to-default basket swaps have been excluded, as
they cannot be meaningfully attributed to a particular reference entity or
country. Exposures to CDPCs are disclosed on page 299.
Government - Comprises central, regional and local government.
Eurozone periphery - Ireland, Spain, Italy, Portugal, Greece and Cyprus.
Other eurozone - Austria, Estonia, Finland, Malta, Slovakia and Slovenia.
Asset quality (AQ) - Refer to Asset quality on page 236.
Refer to page 293 for country analysis of equity shares.