RBS 2013 Annual Report Download - page 416
Download and view the complete annual report
Please find page 416 of the 2013 RBS annual report below. You can navigate through the pages in the report by either clicking on the pages listed below, or by using the keyword search tool below to find specific information within the annual report.-
 1
1 -
2
-
3
-
4
-
5
-
6
-
7
-
8
-
9
-
10
-
11
-
12
-
13
-
14
-
15
-
16
-
17
-
18
-
19
-
20
-
21
-
22
-
23
-
24
-
25
-
26
-
27
-
28
-
29
-
30
-
31
-
32
-
33
-
34
-
35
-
36
-
37
-
38
-
39
-
40
-
41
-
42
-
43
-
44
-
45
-
46
-
47
-
48
-
49
-
50
-
51
-
52
-
53
-
54
-
55
-
56
-
57
-
58
-
59
-
60
-
61
-
62
-
63
-
64
-
65
-
66
-
67
-
68
-
69
-
70
-
71
-
72
-
73
-
74
-
75
-
76
-
77
-
78
-
79
-
80
-
81
-
82
-
83
-
84
-
85
-
86
-
87
-
88
-
89
-
90
-
91
-
92
-
93
-
94
-
95
-
96
-
97
-
98
-
99
-
100
-
101
-
102
-
103
-
104
-
105
-
106
-
107
-
108
-
109
-
110
-
111
-
112
-
113
-
114
-
115
-
116
-
117
-
118
-
119
-
120
-
121
-
122
-
123
-
124
-
125
-
126
-
127
-
128
-
129
-
130
-
131
-
132
-
133
-
134
-
135
-
136
-
137
-
138
-
139
-
140
-
141
-
142
-
143
-
144
-
145
-
146
-
147
-
148
-
149
-
150
-
151
-
152
-
153
-
154
-
155
-
156
-
157
-
158
-
159
-
160
-
161
-
162
-
163
-
164
-
165
-
166
-
167
-
168
-
169
-
170
-
171
-
172
-
173
-
174
-
175
-
176
-
177
-
178
-
179
-
180
-
181
-
182
-
183
-
184
-
185
-
186
-
187
-
188
-
189
-
190
-
191
-
192
-
193
-
194
-
195
-
196
-
197
-
198
-
199
-
200
-
201
-
202
-
203
-
204
-
205
-
206
-
207
-
208
-
209
-
210
-
211
-
212
-
213
-
214
-
215
-
216
-
217
-
218
-
219
-
220
-
221
-
222
-
223
-
224
-
225
-
226
-
227
-
228
-
229
-
230
-
231
-
232
-
233
-
234
-
235
-
236
-
237
-
238
-
239
-
240
-
241
-
242
-
243
-
244
-
245
-
246
-
247
-
248
-
249
-
250
-
251
-
252
-
253
-
254
-
255
-
256
-
257
-
258
-
259
-
260
-
261
-
262
-
263
-
264
-
265
-
266
-
267
-
268
-
269
-
270
-
271
-
272
-
273
-
274
-
275
-
276
-
277
-
278
-
279
-
280
-
281
-
282
-
283
-
284
-
285
-
286
-
287
-
288
-
289
-
290
-
291
-
292
-
293
-
294
-
295
-
296
-
297
-
298
-
299
-
300
-
301
-
302
-
303
-
304
-
305
-
306
-
307
-
308
-
309
-
310
-
311
-
312
-
313
-
314
-
315
-
316
-
317
-
318
-
319
-
320
-
321
-
322
-
323
-
324
-
325
-
326
-
327
-
328
-
329
-
330
-
331
-
332
-
333
-
334
-
335
-
336
-
337
-
338
-
339
-
340
-
341
-
342
-
343
-
344
-
345
-
346
-
347
-
348
-
349
-
350
-
351
-
352
-
353
-
354
-
355
-
356
-
357
-
358
-
359
-
360
-
361
-
362
-
363
-
364
-
365
-
366
-
367
-
368
-
369
-
370
-
371
-
372
-
373
-
374
-
375
-
376
-
377
-
378
-
379
-
380
-
381
-
382
-
383
-
384
-
385
-
386
-
387
-
388
-
389
-
390
-
391
-
392
-
393
-
394
-
395
-
396
-
397
-
398
-
399
-
400
-
401
-
402
-
403
-
404
-
405
-
 406
406 -
 407
407 -
 408
408 -
 409
409 -
 410
410 -
 411
411 -
 412
412 -
 413
413 -
 414
414 -
 415
415 -
 416
416 -
 417
417 -
 418
418 -
 419
419 -
 420
420 -
 421
421 -
 422
422 -
 423
423 -
 424
424 -
 425
425 -
 426
426 -
427
-
428
-
429
-
430
-
431
-
432
-
433
-
434
-
435
-
436
-
437
-
438
-
439
-
440
-
441
-
442
-
443
-
444
-
445
-
446
-
447
-
448
-
449
-
450
-
451
-
452
-
453
-
454
-
455
-
456
-
457
-
458
-
459
-
460
-
461
-
462
-
463
-
464
-
465
-
466
-
467
-
468
-
469
-
470
-
471
-
472
-
473
-
474
-
475
-
476
-
477
-
478
-
479
-
480
-
481
-
482
-
483
-
484
-
485
-
486
-
487
-
488
-
489
-
490
-
491
-
492
-
493
-
494
-
495
-
496
-
497
-
498
-
499
-
500
-
501
-
502
-
503
-
504
-
505
-
506
-
507
-
508
-
509
-
510
-
511
-
512
-
513
-
514
-
515
-
516
-
517
-
518
-
519
-
520
-
521
-
522
-
523
-
524
-
525
-
526
-
527
-
528
-
529
-
530
-
531
-
532
-
533
-
534
-
535
-
536
-
537
-
538
-
539
-
540
-
541
-
542
-
543
-
544
-
545
-
546
-
547
-
548
-
549
-
550
-
551
-
552
-
553
-
554
-
555
-
556
-
557
-
558
-
559
-
560
-
561
-
562
-
563
-
564
 |
 |

Notes on the consolidated accounts
414
11 Financial instruments - valuation continued
The Group uses consensus prices for the source of independent pricing
for some instruments. The consensus service encompasses the equity,
interest rate, currency, commodity, credit, property, fund and bond
markets, providing comprehensive matrices of vanilla prices and a wide
selection of exotic products. Markets and Non-Core contribute to
consensus pricing services where there is a significant interest either
from a positional point of view or to test models for future business use.
Data sourced from consensus pricing services is used for a combination
of control processes including direct price testing, evidence of
observability and model testing. In practice this means that the Group
submits prices for all material positions for which a service is available.
Data from consensus services are subject to the same level of quality
review as other inputs used for IPV process.
In order to determine a reliable fair value, where appropriate,
management applies valuation adjustments to the pricing information
gathered from the above sources. The sources of independent data are
reviewed for quality and are applied in the IPV processes using a
formalised input quality hierarchy. These adjustments reflect the Group's
assessment of factors that market participants would consider in setting a
price. Furthermore, on an ongoing basis, the Group assesses the
appropriateness of any model used. To the extent that the price provided
by internal models does not represent the fair value of the instrument, for
instance in highly stressed market conditions, the Group makes
adjustments to the model valuation to calibrate to other available pricing
sources.
Where unobservable inputs are used, the Group may determine a range
of possible valuations derived from differing stress scenarios to determine
the sensitivity associated with the valuation. When establishing the fair
value of a financial instrument using a valuation technique, the Group
considers adjustments to the modelled price which market participants
would make when pricing that instrument. Such adjustments include the
credit quality of the counterparty and adjustments to compensate for
model limitations.
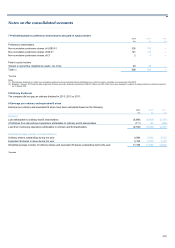
Valuation reserves
When valuing financial instruments in the trading book, adjustments are
made to mid-market valuations to cover bid-offer spread, liquidity and
credit risk. The valuation framework used to determine the fair value of
uncollateralised derivative exposures was refined during the year in line
with market developments. The weightings applied to the expected
losses and gains in the credit valuation adjustments (CVA) and own
credit adjustments (OCA) calculations have been removed. Funding
valuation adjustments (FVA) now reflect the counterparty contingent
nature of the exposures. FVA is also now considered the primary
adjustment applied to liabilities; the extent to which OCA and FVA
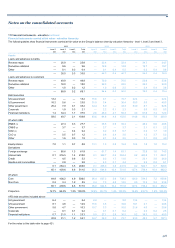
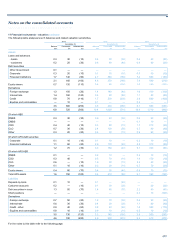
overlap is eliminated from OCA. The following table shows CVA and
other valuation reserves.
Credit valuation adjustments
Credit valuation adjustments represent an estimate of the adjustment to
fair value that a market participant would make to incorporate the
counterparty credit risk inherent in derivative exposures.
2013 2012 2011
£m £m £m
Credit valuation adjustments
- monoline insurers and credit derivative product companies (CDPC) 99 506 2,232
- other counterparties 1,667 2,308 2,254
1,766 2,814 4,486
Other valuation reserves
- bid-offer 513 625 806
- funding valuation adjustment 424 475 552
- product and deal specific 745 763 1,040
- other 8 134 306
1,690 1,997 2,704
Valuation reserves 3,456 4,811 7,190
The table below analyses CVA relating to other counterparties by rating and sector.
2013
Ratings: £m
A
AA 104
A
A to AA+ 13
A
to AA- 168
BBB- to A- 446
Non-investment grade 936
1,667
Sector:
Banks 89
Other financial institutions 199
Corporate 1,126
Government 253
1,667