RBS 2013 Annual Report Download - page 203
Download and view the complete annual report
Please find page 203 of the 2013 RBS annual report below. You can navigate through the pages in the report by either clicking on the pages listed below, or by using the keyword search tool below to find specific information within the annual report.-
 1
1 -
2
-
3
-
4
-
5
-
6
-
7
-
8
-
9
-
10
-
11
-
12
-
13
-
14
-
15
-
16
-
17
-
18
-
19
-
20
-
21
-
22
-
23
-
24
-
25
-
26
-
27
-
28
-
29
-
30
-
31
-
32
-
33
-
34
-
35
-
36
-
37
-
38
-
39
-
40
-
41
-
42
-
43
-
44
-
45
-
46
-
47
-
48
-
49
-
50
-
51
-
52
-
53
-
54
-
55
-
56
-
57
-
58
-
59
-
60
-
61
-
62
-
63
-
64
-
65
-
66
-
67
-
68
-
69
-
70
-
71
-
72
-
73
-
74
-
75
-
76
-
77
-
78
-
79
-
80
-
81
-
82
-
83
-
84
-
85
-
86
-
87
-
88
-
89
-
90
-
91
-
92
-
93
-
94
-
95
-
96
-
97
-
98
-
99
-
100
-
101
-
102
-
103
-
104
-
105
-
106
-
107
-
108
-
109
-
110
-
111
-
112
-
113
-
114
-
115
-
116
-
117
-
118
-
119
-
120
-
121
-
122
-
123
-
124
-
125
-
126
-
127
-
128
-
129
-
130
-
131
-
132
-
133
-
134
-
135
-
136
-
137
-
138
-
139
-
140
-
141
-
142
-
143
-
144
-
145
-
146
-
147
-
148
-
149
-
150
-
151
-
152
-
153
-
154
-
155
-
156
-
157
-
158
-
159
-
160
-
161
-
162
-
163
-
164
-
165
-
166
-
167
-
168
-
169
-
170
-
171
-
172
-
173
-
174
-
175
-
176
-
177
-
178
-
179
-
180
-
181
-
182
-
183
-
184
-
185
-
186
-
187
-
188
-
189
-
190
-
191
-
192
-
 193
193 -
 194
194 -
 195
195 -
 196
196 -
 197
197 -
 198
198 -
 199
199 -
 200
200 -
 201
201 -
 202
202 -
 203
203 -
 204
204 -
 205
205 -
 206
206 -
 207
207 -
 208
208 -
 209
209 -
 210
210 -
 211
211 -
 212
212 -
 213
213 -
214
-
215
-
216
-
217
-
218
-
219
-
220
-
221
-
222
-
223
-
224
-
225
-
226
-
227
-
228
-
229
-
230
-
231
-
232
-
233
-
234
-
235
-
236
-
237
-
238
-
239
-
240
-
241
-
242
-
243
-
244
-
245
-
246
-
247
-
248
-
249
-
250
-
251
-
252
-
253
-
254
-
255
-
256
-
257
-
258
-
259
-
260
-
261
-
262
-
263
-
264
-
265
-
266
-
267
-
268
-
269
-
270
-
271
-
272
-
273
-
274
-
275
-
276
-
277
-
278
-
279
-
280
-
281
-
282
-
283
-
284
-
285
-
286
-
287
-
288
-
289
-
290
-
291
-
292
-
293
-
294
-
295
-
296
-
297
-
298
-
299
-
300
-
301
-
302
-
303
-
304
-
305
-
306
-
307
-
308
-
309
-
310
-
311
-
312
-
313
-
314
-
315
-
316
-
317
-
318
-
319
-
320
-
321
-
322
-
323
-
324
-
325
-
326
-
327
-
328
-
329
-
330
-
331
-
332
-
333
-
334
-
335
-
336
-
337
-
338
-
339
-
340
-
341
-
342
-
343
-
344
-
345
-
346
-
347
-
348
-
349
-
350
-
351
-
352
-
353
-
354
-
355
-
356
-
357
-
358
-
359
-
360
-
361
-
362
-
363
-
364
-
365
-
366
-
367
-
368
-
369
-
370
-
371
-
372
-
373
-
374
-
375
-
376
-
377
-
378
-
379
-
380
-
381
-
382
-
383
-
384
-
385
-
386
-
387
-
388
-
389
-
390
-
391
-
392
-
393
-
394
-
395
-
396
-
397
-
398
-
399
-
400
-
401
-
402
-
403
-
404
-
405
-
406
-
407
-
408
-
409
-
410
-
411
-
412
-
413
-
414
-
415
-
416
-
417
-
418
-
419
-
420
-
421
-
422
-
423
-
424
-
425
-
426
-
427
-
428
-
429
-
430
-
431
-
432
-
433
-
434
-
435
-
436
-
437
-
438
-
439
-
440
-
441
-
442
-
443
-
444
-
445
-
446
-
447
-
448
-
449
-
450
-
451
-
452
-
453
-
454
-
455
-
456
-
457
-
458
-
459
-
460
-
461
-
462
-
463
-
464
-
465
-
466
-
467
-
468
-
469
-
470
-
471
-
472
-
473
-
474
-
475
-
476
-
477
-
478
-
479
-
480
-
481
-
482
-
483
-
484
-
485
-
486
-
487
-
488
-
489
-
490
-
491
-
492
-
493
-
494
-
495
-
496
-
497
-
498
-
499
-
500
-
501
-
502
-
503
-
504
-
505
-
506
-
507
-
508
-
509
-
510
-
511
-
512
-
513
-
514
-
515
-
516
-
517
-
518
-
519
-
520
-
521
-
522
-
523
-
524
-
525
-
526
-
527
-
528
-
529
-
530
-
531
-
532
-
533
-
534
-
535
-
536
-
537
-
538
-
539
-
540
-
541
-
542
-
543
-
544
-
545
-
546
-
547
-
548
-
549
-
550
-
551
-
552
-
553
-
554
-
555
-
556
-
557
-
558
-
559
-
560
-
561
-
562
-
563
-
564
 |
 |

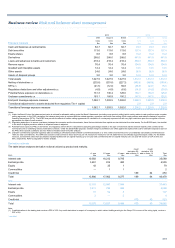
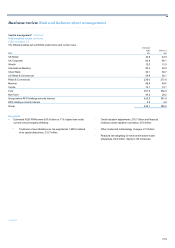
Business review Risk and balance sheet management
201
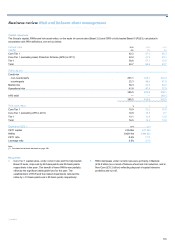
2013 2012
CRR Basel III BCBS CRR Basel III BCBS
basis basis basis basis basis basis
Exposure measure £bn £bn £bn £bn £bn £bn
Cash and balances at central banks 82.7 82.7 82.7 79.3 79.3 79.3
Debt securities 113.6 113.6 113.6 157.4 157.4 157.4
Equity shares 8.8 8.8 8.8 15.2 15.2 15.2
Derivatives 288.0 288.0 288.0 441.9 441.9 441.9
Loans and advances to banks and customers 418.4 418.4 418.4 459.3 459.3 459.3
Reverse repos 76.4 76.4 76.4 104.8 104.8 104.8
Goodwill and intangible assets 12.4 12.4 12.4 13.5 13.5 13.5
Other assets 24.6 24.6 24.6 26.9 26.9 26.9
A
ssets of disposal groups 3.0 3.0 3.0 14.0 14.0 14.0
Total assets 1,027.9 1,027.9 1,027.9 1,312.3 1,312.3 1,312.3
Netting of derivatives (1) (233.8) (233.8) (227.3) (369.8) (369.8) (358.4)
SFTs (1) (41.5) (12.0) 59.8 (45.9) (23.1) 75.5
Regulatory deductions and other adjustments (2) (4.9) (4.9) (6.6) (14.9) (14.9) (20.9)
Potential future exposure on derivatives (3) 131.3 130.4 128.0 133.1 130.9 125.8
Undrawn commitments (4) 183.1 185.9 100.2 187.5 187.5 102.6
End point leverage exposure measure 1,062.1 1,093.5 1,082.0 1,202.3 1,222.9 1,236.9
Transitional adjustments to assets deducted from regulatory Tier 1 capital 2.9 2.9 2.9
Transitional leverage exposure measure 1,062.1 1,093.5 1,082.0 1,205.2 1,225.8 1,239.8
Notes:
(1) Under the Basel III view, the balance sheet value is reduced for allowable netting under the Basel II framework (excluding cross-product netting) which mainly relates to cash positions under a master
netting agreement. In the CRR calculation, the balance sheet value is replaced with the related regulatory exposure value which has netting of both cash positions and related collateral of securities
financing transactions (SFTs). The BCBS view permits the effects of master netting agreements for calculation of counterparty exposure but with very tight restrictions upon the recognition of those
agreements for offset of cash received.
(2) Regulatory deductions: to ensure consistency between the numerator and the denominator, items that are deducted from capital are also deducted from total assets. For the BCBS basis, the shortfall
in the stock of eligible provisions relative to expected losses is adjusted.
(3) Potential future exposure (PFE) on derivatives: the regulatory add-on which is calculated by assigning percentages based on the type of instrument and the residual maturity of the contract to the
nominal amounts or underlying values of derivative contracts. Under the latest BCBS proposal, variation margin is permitted to be offset against the replacement cost for derivative exposures (but not
the PFE) where specific conditions are met. Refer to the table below for further analysis.
(4) Undrawn commitments represent regulatory add-ons relating to off-balance sheet undrawn commitments based on a 10% credit conversion factor for unconditionally cancellable commitments and
100% for other commitments. The CRR basis uses the credit conversion factor (CCF) as per risk measure for medium to low risk trade finance and officially supported export credits. For the BCBS
measure, commitments other than securitisation liquidity facilities with an original maturity up to one year and commitments with an original maturity over one year will receive a CCF of 20% and
50%, respectively. Refer to page 202 for further analysis.
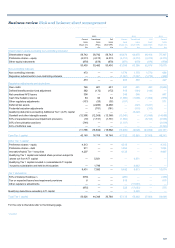
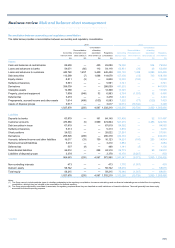
Derivative notionals
The table below analyses derivative notional values by product and maturity.
Credit Credit
derivative 5% derivative 10%
<1 year 1-5 years >5 years add on factor (1) add on factor (1) Total
2013 £bn £bn £bn £bn £bn £bn
Interest rate 10,582 16,212 8,795 35,589
Exchange rate 3,261 814 480 4,555
Equity 43 35 1 79
Commodities — 1 1 2
Credit risk 189 64 253
Total 13,886 17,062 9,277 189 64 40,478
2012
Interest rate 12,515 12,980 7,988 33,483
Exchange rate 3,411 795 492 4,698
Equity 51 52 4 107
Commodities 2 — 2 4
Credit risk 470 83 553
Total 15,979 13,827 8,486 470 83 38,845
Note:
(1) Credit derivatives in the trading book receive a PFE of 10%. Any credit derivatives in respect of a company in which a direct holding would give the Group 10% or more of the voting rights, receive a
PFE of 5%.
*unaudited