RBS 2013 Annual Report Download - page 521
Download and view the complete annual report
Please find page 521 of the 2013 RBS annual report below. You can navigate through the pages in the report by either clicking on the pages listed below, or by using the keyword search tool below to find specific information within the annual report.-
 1
1 -
2
-
3
-
4
-
5
-
6
-
7
-
8
-
9
-
10
-
11
-
12
-
13
-
14
-
15
-
16
-
17
-
18
-
19
-
20
-
21
-
22
-
23
-
24
-
25
-
26
-
27
-
28
-
29
-
30
-
31
-
32
-
33
-
34
-
35
-
36
-
37
-
38
-
39
-
40
-
41
-
42
-
43
-
44
-
45
-
46
-
47
-
48
-
49
-
50
-
51
-
52
-
53
-
54
-
55
-
56
-
57
-
58
-
59
-
60
-
61
-
62
-
63
-
64
-
65
-
66
-
67
-
68
-
69
-
70
-
71
-
72
-
73
-
74
-
75
-
76
-
77
-
78
-
79
-
80
-
81
-
82
-
83
-
84
-
85
-
86
-
87
-
88
-
89
-
90
-
91
-
92
-
93
-
94
-
95
-
96
-
97
-
98
-
99
-
100
-
101
-
102
-
103
-
104
-
105
-
106
-
107
-
108
-
109
-
110
-
111
-
112
-
113
-
114
-
115
-
116
-
117
-
118
-
119
-
120
-
121
-
122
-
123
-
124
-
125
-
126
-
127
-
128
-
129
-
130
-
131
-
132
-
133
-
134
-
135
-
136
-
137
-
138
-
139
-
140
-
141
-
142
-
143
-
144
-
145
-
146
-
147
-
148
-
149
-
150
-
151
-
152
-
153
-
154
-
155
-
156
-
157
-
158
-
159
-
160
-
161
-
162
-
163
-
164
-
165
-
166
-
167
-
168
-
169
-
170
-
171
-
172
-
173
-
174
-
175
-
176
-
177
-
178
-
179
-
180
-
181
-
182
-
183
-
184
-
185
-
186
-
187
-
188
-
189
-
190
-
191
-
192
-
193
-
194
-
195
-
196
-
197
-
198
-
199
-
200
-
201
-
202
-
203
-
204
-
205
-
206
-
207
-
208
-
209
-
210
-
211
-
212
-
213
-
214
-
215
-
216
-
217
-
218
-
219
-
220
-
221
-
222
-
223
-
224
-
225
-
226
-
227
-
228
-
229
-
230
-
231
-
232
-
233
-
234
-
235
-
236
-
237
-
238
-
239
-
240
-
241
-
242
-
243
-
244
-
245
-
246
-
247
-
248
-
249
-
250
-
251
-
252
-
253
-
254
-
255
-
256
-
257
-
258
-
259
-
260
-
261
-
262
-
263
-
264
-
265
-
266
-
267
-
268
-
269
-
270
-
271
-
272
-
273
-
274
-
275
-
276
-
277
-
278
-
279
-
280
-
281
-
282
-
283
-
284
-
285
-
286
-
287
-
288
-
289
-
290
-
291
-
292
-
293
-
294
-
295
-
296
-
297
-
298
-
299
-
300
-
301
-
302
-
303
-
304
-
305
-
306
-
307
-
308
-
309
-
310
-
311
-
312
-
313
-
314
-
315
-
316
-
317
-
318
-
319
-
320
-
321
-
322
-
323
-
324
-
325
-
326
-
327
-
328
-
329
-
330
-
331
-
332
-
333
-
334
-
335
-
336
-
337
-
338
-
339
-
340
-
341
-
342
-
343
-
344
-
345
-
346
-
347
-
348
-
349
-
350
-
351
-
352
-
353
-
354
-
355
-
356
-
357
-
358
-
359
-
360
-
361
-
362
-
363
-
364
-
365
-
366
-
367
-
368
-
369
-
370
-
371
-
372
-
373
-
374
-
375
-
376
-
377
-
378
-
379
-
380
-
381
-
382
-
383
-
384
-
385
-
386
-
387
-
388
-
389
-
390
-
391
-
392
-
393
-
394
-
395
-
396
-
397
-
398
-
399
-
400
-
401
-
402
-
403
-
404
-
405
-
406
-
407
-
408
-
409
-
410
-
411
-
412
-
413
-
414
-
415
-
416
-
417
-
418
-
419
-
420
-
421
-
422
-
423
-
424
-
425
-
426
-
427
-
428
-
429
-
430
-
431
-
432
-
433
-
434
-
435
-
436
-
437
-
438
-
439
-
440
-
441
-
442
-
443
-
444
-
445
-
446
-
447
-
448
-
449
-
450
-
451
-
452
-
453
-
454
-
455
-
456
-
457
-
458
-
459
-
460
-
461
-
462
-
463
-
464
-
465
-
466
-
467
-
468
-
469
-
470
-
471
-
472
-
473
-
474
-
475
-
476
-
477
-
478
-
479
-
480
-
481
-
482
-
483
-
484
-
485
-
486
-
487
-
488
-
489
-
490
-
491
-
492
-
493
-
494
-
495
-
496
-
497
-
498
-
499
-
500
-
501
-
502
-
503
-
504
-
505
-
506
-
507
-
508
-
509
-
510
-
 511
511 -
 512
512 -
 513
513 -
 514
514 -
 515
515 -
 516
516 -
 517
517 -
 518
518 -
 519
519 -
 520
520 -
 521
521 -
 522
522 -
 523
523 -
 524
524 -
 525
525 -
 526
526 -
 527
527 -
 528
528 -
 529
529 -
 530
530 -
 531
531 -
532
-
533
-
534
-
535
-
536
-
537
-
538
-
539
-
540
-
541
-
542
-
543
-
544
-
545
-
546
-
547
-
548
-
549
-
550
-
551
-
552
-
553
-
554
-
555
-
556
-
557
-
558
-
559
-
560
-
561
-
562
-
563
-
564
 |
 |

Additional information
519
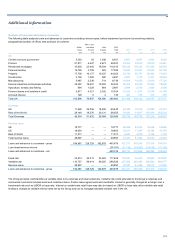
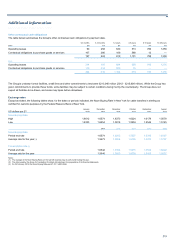
Other contractual cash obligations
The table below summarises the Group's other contractual cash obligations by payment date.
0-3 months 3-12 months 1-3 years 3-5 years 5-10 years 10-20 years
2013 £m £m £m £m £m £m
Operating leases 90 258 630 513 786 1,358
Contractual obligations to purchase goods or services 107 266 189 588 12 —
197 524 819 1,101 798 1,358
2012
Operating leases 214 185 694 559 910 1,376
Contractual obligations to purchase goods or services 110 334 500 15 — —
324 519 1,194 574 910 1,376
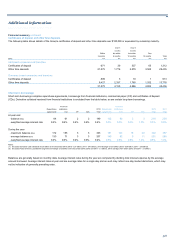
The Group's undrawn formal facilities, credit lines and other commitments to lend were £213,046 million (2012 - £215,808 million). While the Group has
given commitments to provide these funds, some facilities may be subject to certain conditions being met by the counterparty. The Group does not
expect all facilities to be drawn, and some may lapse before drawdown.
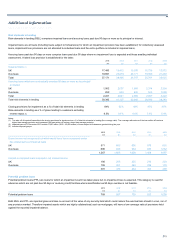
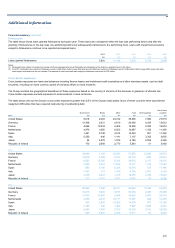
Exchange rates
Except as stated, the following tables show, for the dates or periods indicated, the Noon Buying Rate in New York for cable transfers in sterling as
certified for customs purposes by the Federal Reserve Bank of New York.
January December November October September August
US dollars per £1 2014 2013 2013 2013 2013 2013
Noon Buying Rate
High 1.6612 1.6574 1.6373 1.6224 1.6179 1.5678
Low 1.6335 1.6254 1.5916 1.5904 1.5544 1.5145
2013 2012 2011 2010 2009
Noon Buying Rate
Period end rate 1.6574 1.6262 1.5537 1.5392 1.6167
A
verage rate for the yea
r
(1) 1.5673 1.5924 1.6105 1.5415 1.5707
Consolidation rate (2)
Period end rate 1.6542 1.6164 1.5475 1.5524 1.6222
A
verage rate for the yea
r
1.5646 1.5850 1.6039 1.5455 1.5657
Notes:
(1) The average of the Noon Buying Rates on the last US business day of each month during the year.
(2) The rates used by the Group for translating US dollars into sterling in the preparation of its financial statements.
(3) On 25 February 2014, the Noon Buying Rate was £1.00 = US$1.6696.