RBS 2013 Annual Report Download - page 12
Download and view the complete annual report
Please find page 12 of the 2013 RBS annual report below. You can navigate through the pages in the report by either clicking on the pages listed below, or by using the keyword search tool below to find specific information within the annual report.-
 1
1 -
 2
2 -
 3
3 -
 4
4 -
 5
5 -
 6
6 -
 7
7 -
 8
8 -
 9
9 -
 10
10 -
 11
11 -
 12
12 -
 13
13 -
 14
14 -
 15
15 -
 16
16 -
 17
17 -
 18
18 -
 19
19 -
 20
20 -
 21
21 -
 22
22 -
23
-
24
-
25
-
26
-
27
-
28
-
29
-
30
-
31
-
32
-
33
-
34
-
35
-
36
-
37
-
38
-
39
-
40
-
41
-
42
-
43
-
44
-
45
-
46
-
47
-
48
-
49
-
50
-
51
-
52
-
53
-
54
-
55
-
56
-
57
-
58
-
59
-
60
-
61
-
62
-
63
-
64
-
65
-
66
-
67
-
68
-
69
-
70
-
71
-
72
-
73
-
74
-
75
-
76
-
77
-
78
-
79
-
80
-
81
-
82
-
83
-
84
-
85
-
86
-
87
-
88
-
89
-
90
-
91
-
92
-
93
-
94
-
95
-
96
-
97
-
98
-
99
-
100
-
101
-
102
-
103
-
104
-
105
-
106
-
107
-
108
-
109
-
110
-
111
-
112
-
113
-
114
-
115
-
116
-
117
-
118
-
119
-
120
-
121
-
122
-
123
-
124
-
125
-
126
-
127
-
128
-
129
-
130
-
131
-
132
-
133
-
134
-
135
-
136
-
137
-
138
-
139
-
140
-
141
-
142
-
143
-
144
-
145
-
146
-
147
-
148
-
149
-
150
-
151
-
152
-
153
-
154
-
155
-
156
-
157
-
158
-
159
-
160
-
161
-
162
-
163
-
164
-
165
-
166
-
167
-
168
-
169
-
170
-
171
-
172
-
173
-
174
-
175
-
176
-
177
-
178
-
179
-
180
-
181
-
182
-
183
-
184
-
185
-
186
-
187
-
188
-
189
-
190
-
191
-
192
-
193
-
194
-
195
-
196
-
197
-
198
-
199
-
200
-
201
-
202
-
203
-
204
-
205
-
206
-
207
-
208
-
209
-
210
-
211
-
212
-
213
-
214
-
215
-
216
-
217
-
218
-
219
-
220
-
221
-
222
-
223
-
224
-
225
-
226
-
227
-
228
-
229
-
230
-
231
-
232
-
233
-
234
-
235
-
236
-
237
-
238
-
239
-
240
-
241
-
242
-
243
-
244
-
245
-
246
-
247
-
248
-
249
-
250
-
251
-
252
-
253
-
254
-
255
-
256
-
257
-
258
-
259
-
260
-
261
-
262
-
263
-
264
-
265
-
266
-
267
-
268
-
269
-
270
-
271
-
272
-
273
-
274
-
275
-
276
-
277
-
278
-
279
-
280
-
281
-
282
-
283
-
284
-
285
-
286
-
287
-
288
-
289
-
290
-
291
-
292
-
293
-
294
-
295
-
296
-
297
-
298
-
299
-
300
-
301
-
302
-
303
-
304
-
305
-
306
-
307
-
308
-
309
-
310
-
311
-
312
-
313
-
314
-
315
-
316
-
317
-
318
-
319
-
320
-
321
-
322
-
323
-
324
-
325
-
326
-
327
-
328
-
329
-
330
-
331
-
332
-
333
-
334
-
335
-
336
-
337
-
338
-
339
-
340
-
341
-
342
-
343
-
344
-
345
-
346
-
347
-
348
-
349
-
350
-
351
-
352
-
353
-
354
-
355
-
356
-
357
-
358
-
359
-
360
-
361
-
362
-
363
-
364
-
365
-
366
-
367
-
368
-
369
-
370
-
371
-
372
-
373
-
374
-
375
-
376
-
377
-
378
-
379
-
380
-
381
-
382
-
383
-
384
-
385
-
386
-
387
-
388
-
389
-
390
-
391
-
392
-
393
-
394
-
395
-
396
-
397
-
398
-
399
-
400
-
401
-
402
-
403
-
404
-
405
-
406
-
407
-
408
-
409
-
410
-
411
-
412
-
413
-
414
-
415
-
416
-
417
-
418
-
419
-
420
-
421
-
422
-
423
-
424
-
425
-
426
-
427
-
428
-
429
-
430
-
431
-
432
-
433
-
434
-
435
-
436
-
437
-
438
-
439
-
440
-
441
-
442
-
443
-
444
-
445
-
446
-
447
-
448
-
449
-
450
-
451
-
452
-
453
-
454
-
455
-
456
-
457
-
458
-
459
-
460
-
461
-
462
-
463
-
464
-
465
-
466
-
467
-
468
-
469
-
470
-
471
-
472
-
473
-
474
-
475
-
476
-
477
-
478
-
479
-
480
-
481
-
482
-
483
-
484
-
485
-
486
-
487
-
488
-
489
-
490
-
491
-
492
-
493
-
494
-
495
-
496
-
497
-
498
-
499
-
500
-
501
-
502
-
503
-
504
-
505
-
506
-
507
-
508
-
509
-
510
-
511
-
512
-
513
-
514
-
515
-
516
-
517
-
518
-
519
-
520
-
521
-
522
-
523
-
524
-
525
-
526
-
527
-
528
-
529
-
530
-
531
-
532
-
533
-
534
-
535
-
536
-
537
-
538
-
539
-
540
-
541
-
542
-
543
-
544
-
545
-
546
-
547
-
548
-
549
-
550
-
551
-
552
-
553
-
554
-
555
-
556
-
557
-
558
-
559
-
560
-
561
-
562
-
563
-
564
 |
 |

10
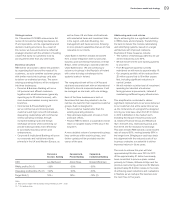
Delivery of 2009-2013 Strategic Plan
In 2009 RBS set out a five year strategic plan
aimed at restoring RBS to standalone strength.
The plan was built on four business objectives:
• To base RBS on enduring customer
franchises, with each business capable of
generating a sustainable return in excess of
its cost of capital;
• To deliver the RBS strategy from a stable
risk profile and balance sheet, with each
banking business self-funding (100%
loan:deposit ratio);
• To deliver an attractive blend of profitability,
stability and sustainable growth from the
chosen business mix; and
• Management hallmarks to include an open,
investor-friendly approach; discipline and
proven execution effectiveness; strong risk
management; and central focus on serving
our customers well.
We set out key measures and have consistently
reported on our progress against these over
the course of the five year plan. Progress
against the risk measures has been strong,
with all targets exceeded, in some cases by
very large margins. Progress against value
drivers, however, has not lived up to our
expectations at the time the plan was
established, with deterioration in both return
on equity and cost:income ratio.
Progress versus Strategic plan
Key Measures Worst point 2012 2013
Value drivers Core Core
Return on equity (1) (31%)(2) 8.9% 4.6%
Cost:income ratio 97%(3) 59% 64%
Risk measures Group Group
Core Tier 1 ratio 4%(4) 10.3% 10.9%
Loan:deposit ratio 154%(5) 100% 94%
Short-term wholesale funding (STWF) £297bn(6) £42bn £32bn
Liquidity portfolio (7) £90bn(6) £147bn £146bn
Leverage ratio (8) 28.7x(9) 15.0x 14.4x
Notes:
(1) Based on indicative Core attributable profit taxed at standard rates and Core average tangible equity per the average
balance sheet (89% of Group tangible equity based on RWAs at 31 December 2013);
(2) Return on tangible equity for 2008;
(3) Year ended 31 December 2008;
(4) As at 1 January 2008;
(5) As at October 2008;
(6) As at December 2008;
(7) Eligible assets held for contingent liquidity purposes including cash, Government issued securities and other eligible
securities with central banks;
(8) Funded tangible assets divided by total Tier 1 capital; and
(9) As at June 2008.
Measures
Future performance will be reported against both customer and financial measures.
Measure 2013 Medium term Long term
Customer Service
(1) <25% of businesses at #1 All businesses at #1
Trust #1 trusted bank in the UK
People Great place to work Engagement index ≥
Global Financial Services
norm (2)
Efficiency Cost:income ratio 73% (3) ~55% (3) ~50% (3)
Costs £13.3 billion ~£8 billion (3)
Returns Return on tangible equity (4) Negative ~9-11% 12%+
Capital strength Common Equity Tier 1 ratio (5) 8.6% ≥12% ≥12%
Leverage ratio (5) 3.5% 3.5-4% ≥4%
Notes:
(1) Measured by Net Promoter Score, with the exception of Corporate & Institutional Banking, which will use customer satisfaction. NPS nets the percentage of
“promoters” (loyal enthusiasts of the company) and the percentage of “detractors” (unhappy customers) to give a measure of customer advocacy.
(2) Global Financial Services norm currently stands at 82%.
(3) Including bank levy, restructuring charges and, from 2015, the EU resolution fund charge.
(4) Calculated with tangible equity based on CET1 ratio of 12%.
(5) Fully loaded Basel III.
(6) This table contains forecasts with significant contingencies. Please refer to ‘Forward Looking Statements’ and ‘Risk Factors’.