RBS 2013 Annual Report Download - page 401
Download and view the complete annual report
Please find page 401 of the 2013 RBS annual report below. You can navigate through the pages in the report by either clicking on the pages listed below, or by using the keyword search tool below to find specific information within the annual report.-
 1
1 -
2
-
3
-
4
-
5
-
6
-
7
-
8
-
9
-
10
-
11
-
12
-
13
-
14
-
15
-
16
-
17
-
18
-
19
-
20
-
21
-
22
-
23
-
24
-
25
-
26
-
27
-
28
-
29
-
30
-
31
-
32
-
33
-
34
-
35
-
36
-
37
-
38
-
39
-
40
-
41
-
42
-
43
-
44
-
45
-
46
-
47
-
48
-
49
-
50
-
51
-
52
-
53
-
54
-
55
-
56
-
57
-
58
-
59
-
60
-
61
-
62
-
63
-
64
-
65
-
66
-
67
-
68
-
69
-
70
-
71
-
72
-
73
-
74
-
75
-
76
-
77
-
78
-
79
-
80
-
81
-
82
-
83
-
84
-
85
-
86
-
87
-
88
-
89
-
90
-
91
-
92
-
93
-
94
-
95
-
96
-
97
-
98
-
99
-
100
-
101
-
102
-
103
-
104
-
105
-
106
-
107
-
108
-
109
-
110
-
111
-
112
-
113
-
114
-
115
-
116
-
117
-
118
-
119
-
120
-
121
-
122
-
123
-
124
-
125
-
126
-
127
-
128
-
129
-
130
-
131
-
132
-
133
-
134
-
135
-
136
-
137
-
138
-
139
-
140
-
141
-
142
-
143
-
144
-
145
-
146
-
147
-
148
-
149
-
150
-
151
-
152
-
153
-
154
-
155
-
156
-
157
-
158
-
159
-
160
-
161
-
162
-
163
-
164
-
165
-
166
-
167
-
168
-
169
-
170
-
171
-
172
-
173
-
174
-
175
-
176
-
177
-
178
-
179
-
180
-
181
-
182
-
183
-
184
-
185
-
186
-
187
-
188
-
189
-
190
-
191
-
192
-
193
-
194
-
195
-
196
-
197
-
198
-
199
-
200
-
201
-
202
-
203
-
204
-
205
-
206
-
207
-
208
-
209
-
210
-
211
-
212
-
213
-
214
-
215
-
216
-
217
-
218
-
219
-
220
-
221
-
222
-
223
-
224
-
225
-
226
-
227
-
228
-
229
-
230
-
231
-
232
-
233
-
234
-
235
-
236
-
237
-
238
-
239
-
240
-
241
-
242
-
243
-
244
-
245
-
246
-
247
-
248
-
249
-
250
-
251
-
252
-
253
-
254
-
255
-
256
-
257
-
258
-
259
-
260
-
261
-
262
-
263
-
264
-
265
-
266
-
267
-
268
-
269
-
270
-
271
-
272
-
273
-
274
-
275
-
276
-
277
-
278
-
279
-
280
-
281
-
282
-
283
-
284
-
285
-
286
-
287
-
288
-
289
-
290
-
291
-
292
-
293
-
294
-
295
-
296
-
297
-
298
-
299
-
300
-
301
-
302
-
303
-
304
-
305
-
306
-
307
-
308
-
309
-
310
-
311
-
312
-
313
-
314
-
315
-
316
-
317
-
318
-
319
-
320
-
321
-
322
-
323
-
324
-
325
-
326
-
327
-
328
-
329
-
330
-
331
-
332
-
333
-
334
-
335
-
336
-
337
-
338
-
339
-
340
-
341
-
342
-
343
-
344
-
345
-
346
-
347
-
348
-
349
-
350
-
351
-
352
-
353
-
354
-
355
-
356
-
357
-
358
-
359
-
360
-
361
-
362
-
363
-
364
-
365
-
366
-
367
-
368
-
369
-
370
-
371
-
372
-
373
-
374
-
375
-
376
-
377
-
378
-
379
-
380
-
381
-
382
-
383
-
384
-
385
-
386
-
387
-
388
-
389
-
390
-
 391
391 -
 392
392 -
 393
393 -
 394
394 -
 395
395 -
 396
396 -
 397
397 -
 398
398 -
 399
399 -
 400
400 -
 401
401 -
 402
402 -
 403
403 -
 404
404 -
 405
405 -
 406
406 -
 407
407 -
 408
408 -
 409
409 -
 410
410 -
 411
411 -
412
-
413
-
414
-
415
-
416
-
417
-
418
-
419
-
420
-
421
-
422
-
423
-
424
-
425
-
426
-
427
-
428
-
429
-
430
-
431
-
432
-
433
-
434
-
435
-
436
-
437
-
438
-
439
-
440
-
441
-
442
-
443
-
444
-
445
-
446
-
447
-
448
-
449
-
450
-
451
-
452
-
453
-
454
-
455
-
456
-
457
-
458
-
459
-
460
-
461
-
462
-
463
-
464
-
465
-
466
-
467
-
468
-
469
-
470
-
471
-
472
-
473
-
474
-
475
-
476
-
477
-
478
-
479
-
480
-
481
-
482
-
483
-
484
-
485
-
486
-
487
-
488
-
489
-
490
-
491
-
492
-
493
-
494
-
495
-
496
-
497
-
498
-
499
-
500
-
501
-
502
-
503
-
504
-
505
-
506
-
507
-
508
-
509
-
510
-
511
-
512
-
513
-
514
-
515
-
516
-
517
-
518
-
519
-
520
-
521
-
522
-
523
-
524
-
525
-
526
-
527
-
528
-
529
-
530
-
531
-
532
-
533
-
534
-
535
-
536
-
537
-
538
-
539
-
540
-
541
-
542
-
543
-
544
-
545
-
546
-
547
-
548
-
549
-
550
-
551
-
552
-
553
-
554
-
555
-
556
-
557
-
558
-
559
-
560
-
561
-
562
-
563
-
564
 |
 |

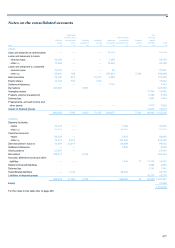
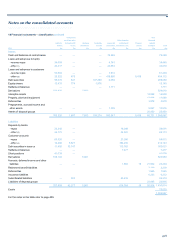
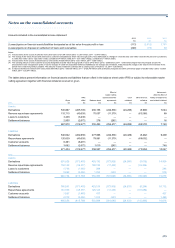
Notes on the consolidated accounts
399
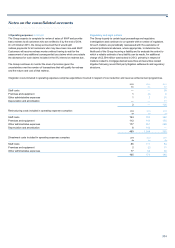
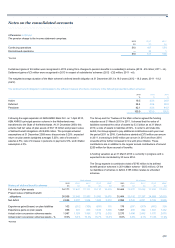
Discount rate
The Group discounts its defined benefit pension obligations at discount
rates determined by reference to the yield on ‘high quality’ corporate
bonds.
The sterling yield curve (applied to 92% of the Group’s defined benefit
obligations) is constructed by reference to yields on ‘AA’ corporate bonds
from which a single discount rate is derived based on a cash flow profile
similar in structure and duration to the pension obligations. Significant
judgement is required when setting the criteria for bonds to be included in
the population from which the yield curve is derived. The criteria include
issue size, quality of pricing and the exclusion of outliers. Judgement is
also required in determining the shape of the yield curve at long
durations: a constant credit spread relative to gilts is assumed.
Prior to 2012 the discount rate was determined by reference to the upper
quartile yield on the iBoxx over 15 year sterling corporate bond index,
less a margin determined by reference to the shape of the yield curve
and the spread of yields among the index’s constituents.
Discount rates for other currencies are derived using a variety of
methodologies. In the case of US dollar defined benefit obligations, a
matching portfolio of high-quality ‘AA’ corporate bonds is used for the first
30 years’ cash flows; cash flows beyond 30 years are discounted using a
yield curve determined in a similar way to the UK. For euro defined
benefit obligations, a similar approach to the UK has been used at 31
December 2013. However, at longer durations, rates are derived by
extrapolating yields on ‘A’ and ‘AAA’ corporate bonds to derive equivalent
‘AA’ yields. Prior to 2012, extrapolation was not used at longer durations
and different criteria were used to determine the reference pool of ‘AA’
bonds.
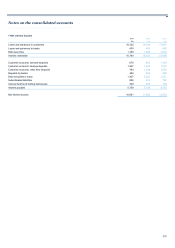
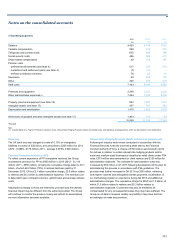
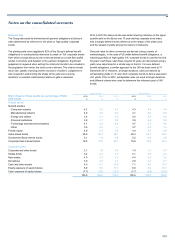
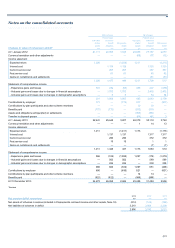
Main scheme All schemes
2013 2012 2011 2013 2012 2011
Major classes of plan assets as a percentage of total
plan assets % % % % % %
Quoted assets
Quoted equities
- Consumer industry 4.2 4.2 4.7 4.3 4.4 4.9
- Manufacturing industry 4.0 5.6 5.3 4.1 6.0 5.5
- Energy and utilities 3.6 4.1 2.5 3.6 4.4 2.6
- Financial institutions 3.9 4.1 3.6 3.9 4.4 3.8
- Technology and telecommunications 4.7 4.9 4.8 4.7 5.3 4.9
- Other 3.5 0.5 — 3.7 0.5 1.6
Private equity 4.9 5.4 5.8 4.4 4.7 4.9
Index-linked bonds 29.0 30.7 26.1 28.3 28.7 24.3
Government fixed interest bonds 2.1 1.9 0.9 2.2 2.9 2.8
Corporate fixed interest bonds 19.5 19.5 23.1 19.6 19.5 21.5
Unquoted assets
Corporate and other bonds 2.1 1.6 0.8 1.9 1.5 0.7
Hedge funds 5.2 2.2 2.5 5.1 2.5 2.4
Real estate 4.0 4.3 3.5 4.0 4.2 3.6
Derivatives 3.0 2.2 2.4 2.8 2.0 2.1
Cash and other assets 6.0 8.7 13.8 7.1 9.0 13.7
Equity exposure of equity futures 8.0 9.0 17.7 8.0 8.4 15.7
Cash exposure of equity futures (7.7) (8.9) (17.5) (7.7) (8.4) (15.0)
100.0 100.0 100.0 100.0 100.0 100.0