RBS 2013 Annual Report Download - page 114
Download and view the complete annual report
Please find page 114 of the 2013 RBS annual report below. You can navigate through the pages in the report by either clicking on the pages listed below, or by using the keyword search tool below to find specific information within the annual report.-
 1
1 -
2
-
3
-
4
-
5
-
6
-
7
-
8
-
9
-
10
-
11
-
12
-
13
-
14
-
15
-
16
-
17
-
18
-
19
-
20
-
21
-
22
-
23
-
24
-
25
-
26
-
27
-
28
-
29
-
30
-
31
-
32
-
33
-
34
-
35
-
36
-
37
-
38
-
39
-
40
-
41
-
42
-
43
-
44
-
45
-
46
-
47
-
48
-
49
-
50
-
51
-
52
-
53
-
54
-
55
-
56
-
57
-
58
-
59
-
60
-
61
-
62
-
63
-
64
-
65
-
66
-
67
-
68
-
69
-
70
-
71
-
72
-
73
-
74
-
75
-
76
-
77
-
78
-
79
-
80
-
81
-
82
-
83
-
84
-
85
-
86
-
87
-
88
-
89
-
90
-
91
-
92
-
93
-
94
-
95
-
96
-
97
-
98
-
99
-
100
-
101
-
102
-
103
-
 104
104 -
 105
105 -
 106
106 -
 107
107 -
 108
108 -
 109
109 -
 110
110 -
 111
111 -
 112
112 -
 113
113 -
 114
114 -
 115
115 -
 116
116 -
 117
117 -
 118
118 -
 119
119 -
 120
120 -
 121
121 -
 122
122 -
 123
123 -
 124
124 -
125
-
126
-
127
-
128
-
129
-
130
-
131
-
132
-
133
-
134
-
135
-
136
-
137
-
138
-
139
-
140
-
141
-
142
-
143
-
144
-
145
-
146
-
147
-
148
-
149
-
150
-
151
-
152
-
153
-
154
-
155
-
156
-
157
-
158
-
159
-
160
-
161
-
162
-
163
-
164
-
165
-
166
-
167
-
168
-
169
-
170
-
171
-
172
-
173
-
174
-
175
-
176
-
177
-
178
-
179
-
180
-
181
-
182
-
183
-
184
-
185
-
186
-
187
-
188
-
189
-
190
-
191
-
192
-
193
-
194
-
195
-
196
-
197
-
198
-
199
-
200
-
201
-
202
-
203
-
204
-
205
-
206
-
207
-
208
-
209
-
210
-
211
-
212
-
213
-
214
-
215
-
216
-
217
-
218
-
219
-
220
-
221
-
222
-
223
-
224
-
225
-
226
-
227
-
228
-
229
-
230
-
231
-
232
-
233
-
234
-
235
-
236
-
237
-
238
-
239
-
240
-
241
-
242
-
243
-
244
-
245
-
246
-
247
-
248
-
249
-
250
-
251
-
252
-
253
-
254
-
255
-
256
-
257
-
258
-
259
-
260
-
261
-
262
-
263
-
264
-
265
-
266
-
267
-
268
-
269
-
270
-
271
-
272
-
273
-
274
-
275
-
276
-
277
-
278
-
279
-
280
-
281
-
282
-
283
-
284
-
285
-
286
-
287
-
288
-
289
-
290
-
291
-
292
-
293
-
294
-
295
-
296
-
297
-
298
-
299
-
300
-
301
-
302
-
303
-
304
-
305
-
306
-
307
-
308
-
309
-
310
-
311
-
312
-
313
-
314
-
315
-
316
-
317
-
318
-
319
-
320
-
321
-
322
-
323
-
324
-
325
-
326
-
327
-
328
-
329
-
330
-
331
-
332
-
333
-
334
-
335
-
336
-
337
-
338
-
339
-
340
-
341
-
342
-
343
-
344
-
345
-
346
-
347
-
348
-
349
-
350
-
351
-
352
-
353
-
354
-
355
-
356
-
357
-
358
-
359
-
360
-
361
-
362
-
363
-
364
-
365
-
366
-
367
-
368
-
369
-
370
-
371
-
372
-
373
-
374
-
375
-
376
-
377
-
378
-
379
-
380
-
381
-
382
-
383
-
384
-
385
-
386
-
387
-
388
-
389
-
390
-
391
-
392
-
393
-
394
-
395
-
396
-
397
-
398
-
399
-
400
-
401
-
402
-
403
-
404
-
405
-
406
-
407
-
408
-
409
-
410
-
411
-
412
-
413
-
414
-
415
-
416
-
417
-
418
-
419
-
420
-
421
-
422
-
423
-
424
-
425
-
426
-
427
-
428
-
429
-
430
-
431
-
432
-
433
-
434
-
435
-
436
-
437
-
438
-
439
-
440
-
441
-
442
-
443
-
444
-
445
-
446
-
447
-
448
-
449
-
450
-
451
-
452
-
453
-
454
-
455
-
456
-
457
-
458
-
459
-
460
-
461
-
462
-
463
-
464
-
465
-
466
-
467
-
468
-
469
-
470
-
471
-
472
-
473
-
474
-
475
-
476
-
477
-
478
-
479
-
480
-
481
-
482
-
483
-
484
-
485
-
486
-
487
-
488
-
489
-
490
-
491
-
492
-
493
-
494
-
495
-
496
-
497
-
498
-
499
-
500
-
501
-
502
-
503
-
504
-
505
-
506
-
507
-
508
-
509
-
510
-
511
-
512
-
513
-
514
-
515
-
516
-
517
-
518
-
519
-
520
-
521
-
522
-
523
-
524
-
525
-
526
-
527
-
528
-
529
-
530
-
531
-
532
-
533
-
534
-
535
-
536
-
537
-
538
-
539
-
540
-
541
-
542
-
543
-
544
-
545
-
546
-
547
-
548
-
549
-
550
-
551
-
552
-
553
-
554
-
555
-
556
-
557
-
558
-
559
-
560
-
561
-
562
-
563
-
564
 |
 |

Business review
112
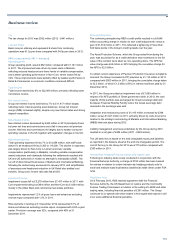
Results summary continued
Non-operating items
The continuing, albeit modest, strengthening of RBS’s credit profile
resulted in a £120 million accounting charge in relation to own credit
adjustments versus £4,649 million in 2012.
To reflect current experience of Payment Protection Insurance complaints
received, the Group increased its PPI provision by £900 million in 2013
compared with £1,110 million in 2012, bringing the cumulative charge
taken to £3.1 billion, of which £2.2 billion had been utilised at 31
December 2013.
Integration and restructuring costs were £656 million compared with
£1,415 million in 2012 with most of the costs relating to the Retail
transformation, a reduction in the size of Markets and programme costs
for the EC mandated disposal of certain UK branch-based businesses.
Write-down of goodwill was £1,059 million compared with £18 million in
2012 as the International Banking division was written off in 2013. Write-
down of other intangible assets, including software, of £344 million
related to Markets.
Liability management exercises undertaken by the Group during 2013
resulted in a net gain of £175 million (2012 - £454 million).
The Asset Protection Scheme, which the Group exited from in 2012, was
accounted for as a credit derivative and movements in the fair value of
the contract were taken as non-operating items. The APS fair value
charge was £44 million in 2012.
The gain on strategic disposals of £161 million primarily relates to the
disposal of the Group’s remaining interest in WorldPay. In 2012 the gain
of £113 million primarily related to the disposal of RBS Aviation Capital.
The UK bank levy is based on the total chargeable equity and liabilities
as reported in the balance sheet at the end of a chargeable period. The
cost of the levy to the Group for 2013 was £200 million compared with
£175 million in 2012.
Interest Rate Hedging Products redress and related costs
Following an industry-wide review in 2012 conducted in conjunction with
the Financial Services Authority, a charge of £700 million was booked for
redress in relation to certain interest-rate hedging products sold to small
and medium-sized businesses classified as retail clients under FSA rules.
In 2013, a further charge of £550 million was booked reflecting both
higher volumes and anticipated redress payments, recalibration of our
methodology based on experience during 2013, and additional
administration charges.
Regulatory and legal actions
Charges relating to regulatory and legal actions totalled £2,394 million
compared with £381 million in 2012. These charges primarily relate to
various claims and conduct related matters affecting Group companies,
primarily those related to mortgage-backed securities and securities
related litigation, following recent litigation settlements and regulatory
decisions.
Tax
The tax charge was £382 million in 2013 compared with £441 million in
2012. The tax charge for the year reflects losses in low tax regimes
(principally Ireland), losses in overseas subsidiaries for which a deferred
tax asset has not been recognised (principally Ireland), a reduction in the
carrying value of the deferred tax asset in respect of UK losses and the
effect of the reduction of 3% in the rate of UK corporation tax enacted in
July 2013.
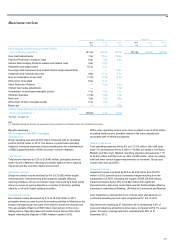
Loss per share
Basic loss from continuing operations was 81.3p per ordinary and
equivalent B share compared with 54.5p in 2012. Adjusted loss from
continuing operations was 38.3p compared with earnings of 4.3p in 2012.
2013 compared with 2012 - statutory
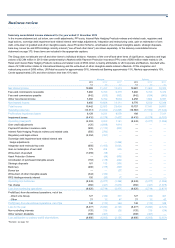
Operating loss
Operating loss before tax for the year was £8,243 million compared with
£5,277 million in 2012.
Total income
Total income increased 10% to £19,757 million in 2013 primarily
reflecting a lower accounting charge for own credit partially offset by
lower income in Markets.
Net interest income
Net interest income decreased by 4% to £10,981 million largely reflecting
lower interest-earning asset balances partially offset by re-pricing
initiatives.
Non-interest income
Non-interest income increased to £8,776 million from £6,539 million in
2012. This included a loss on own credit adjustments of £120 million
(2012 - £4,649 million), net gain on redemption of own debt of £175
million (2012 - £454 million) and movements in the fair value of the Asset
Protection Scheme resulting in a £44 million charge in 2012. Excluding
these items, non-interest income was down 19% compared with 2012.
Operating expenses
Operating expenses increased to £19,568 million from £17,939 million in
2012. This included PPI costs of £900 million (2012 - £1,110 million),
IRHP redress and related costs of £550 million (2012 - £700 million),
regulatory and legal actions of £2,394 million (2012 - £381 million),
integration and restructuring costs of £656 million (2012 - £1,415 million),
write-down of goodwill of £1,059 million (2012 - £18 million) and write-
down of other intangible assets of £344 million (2012 - £106 million).
Excluding these items, operating expenses were down 4% driven by
exiting staff and lower central support requirements on downsizing in
Markets and Non-Core.
Impairment losses
Impairment losses were £8,432 million, including £4,490 million relating
to RCR, compared with £5,279 million in 2012.
Risk elements in lending represented 9.5% of gross loans and advances
to customers excluding reverse repos at 31 December 2013 (2012 –
9.1%).
Provision coverage of risk elements in lending was 64% (2012 - 52%).