RBS 2013 Annual Report Download - page 306
Download and view the complete annual report
Please find page 306 of the 2013 RBS annual report below. You can navigate through the pages in the report by either clicking on the pages listed below, or by using the keyword search tool below to find specific information within the annual report.-
 1
1 -
2
-
3
-
4
-
5
-
6
-
7
-
8
-
9
-
10
-
11
-
12
-
13
-
14
-
15
-
16
-
17
-
18
-
19
-
20
-
21
-
22
-
23
-
24
-
25
-
26
-
27
-
28
-
29
-
30
-
31
-
32
-
33
-
34
-
35
-
36
-
37
-
38
-
39
-
40
-
41
-
42
-
43
-
44
-
45
-
46
-
47
-
48
-
49
-
50
-
51
-
52
-
53
-
54
-
55
-
56
-
57
-
58
-
59
-
60
-
61
-
62
-
63
-
64
-
65
-
66
-
67
-
68
-
69
-
70
-
71
-
72
-
73
-
74
-
75
-
76
-
77
-
78
-
79
-
80
-
81
-
82
-
83
-
84
-
85
-
86
-
87
-
88
-
89
-
90
-
91
-
92
-
93
-
94
-
95
-
96
-
97
-
98
-
99
-
100
-
101
-
102
-
103
-
104
-
105
-
106
-
107
-
108
-
109
-
110
-
111
-
112
-
113
-
114
-
115
-
116
-
117
-
118
-
119
-
120
-
121
-
122
-
123
-
124
-
125
-
126
-
127
-
128
-
129
-
130
-
131
-
132
-
133
-
134
-
135
-
136
-
137
-
138
-
139
-
140
-
141
-
142
-
143
-
144
-
145
-
146
-
147
-
148
-
149
-
150
-
151
-
152
-
153
-
154
-
155
-
156
-
157
-
158
-
159
-
160
-
161
-
162
-
163
-
164
-
165
-
166
-
167
-
168
-
169
-
170
-
171
-
172
-
173
-
174
-
175
-
176
-
177
-
178
-
179
-
180
-
181
-
182
-
183
-
184
-
185
-
186
-
187
-
188
-
189
-
190
-
191
-
192
-
193
-
194
-
195
-
196
-
197
-
198
-
199
-
200
-
201
-
202
-
203
-
204
-
205
-
206
-
207
-
208
-
209
-
210
-
211
-
212
-
213
-
214
-
215
-
216
-
217
-
218
-
219
-
220
-
221
-
222
-
223
-
224
-
225
-
226
-
227
-
228
-
229
-
230
-
231
-
232
-
233
-
234
-
235
-
236
-
237
-
238
-
239
-
240
-
241
-
242
-
243
-
244
-
245
-
246
-
247
-
248
-
249
-
250
-
251
-
252
-
253
-
254
-
255
-
256
-
257
-
258
-
259
-
260
-
261
-
262
-
263
-
264
-
265
-
266
-
267
-
268
-
269
-
270
-
271
-
272
-
273
-
274
-
275
-
276
-
277
-
278
-
279
-
280
-
281
-
282
-
283
-
284
-
285
-
286
-
287
-
288
-
289
-
290
-
291
-
292
-
293
-
294
-
295
-
 296
296 -
 297
297 -
 298
298 -
 299
299 -
 300
300 -
 301
301 -
 302
302 -
 303
303 -
 304
304 -
 305
305 -
 306
306 -
 307
307 -
 308
308 -
 309
309 -
 310
310 -
 311
311 -
 312
312 -
 313
313 -
 314
314 -
 315
315 -
 316
316 -
317
-
318
-
319
-
320
-
321
-
322
-
323
-
324
-
325
-
326
-
327
-
328
-
329
-
330
-
331
-
332
-
333
-
334
-
335
-
336
-
337
-
338
-
339
-
340
-
341
-
342
-
343
-
344
-
345
-
346
-
347
-
348
-
349
-
350
-
351
-
352
-
353
-
354
-
355
-
356
-
357
-
358
-
359
-
360
-
361
-
362
-
363
-
364
-
365
-
366
-
367
-
368
-
369
-
370
-
371
-
372
-
373
-
374
-
375
-
376
-
377
-
378
-
379
-
380
-
381
-
382
-
383
-
384
-
385
-
386
-
387
-
388
-
389
-
390
-
391
-
392
-
393
-
394
-
395
-
396
-
397
-
398
-
399
-
400
-
401
-
402
-
403
-
404
-
405
-
406
-
407
-
408
-
409
-
410
-
411
-
412
-
413
-
414
-
415
-
416
-
417
-
418
-
419
-
420
-
421
-
422
-
423
-
424
-
425
-
426
-
427
-
428
-
429
-
430
-
431
-
432
-
433
-
434
-
435
-
436
-
437
-
438
-
439
-
440
-
441
-
442
-
443
-
444
-
445
-
446
-
447
-
448
-
449
-
450
-
451
-
452
-
453
-
454
-
455
-
456
-
457
-
458
-
459
-
460
-
461
-
462
-
463
-
464
-
465
-
466
-
467
-
468
-
469
-
470
-
471
-
472
-
473
-
474
-
475
-
476
-
477
-
478
-
479
-
480
-
481
-
482
-
483
-
484
-
485
-
486
-
487
-
488
-
489
-
490
-
491
-
492
-
493
-
494
-
495
-
496
-
497
-
498
-
499
-
500
-
501
-
502
-
503
-
504
-
505
-
506
-
507
-
508
-
509
-
510
-
511
-
512
-
513
-
514
-
515
-
516
-
517
-
518
-
519
-
520
-
521
-
522
-
523
-
524
-
525
-
526
-
527
-
528
-
529
-
530
-
531
-
532
-
533
-
534
-
535
-
536
-
537
-
538
-
539
-
540
-
541
-
542
-
543
-
544
-
545
-
546
-
547
-
548
-
549
-
550
-
551
-
552
-
553
-
554
-
555
-
556
-
557
-
558
-
559
-
560
-
561
-
562
-
563
-
564
 |
 |

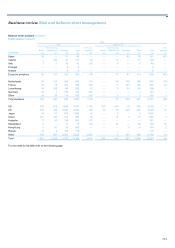
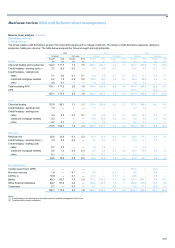
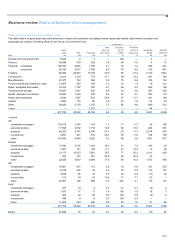
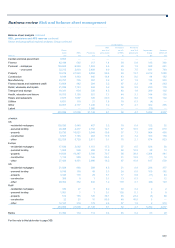
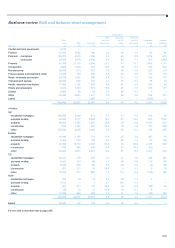
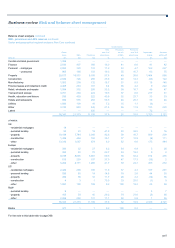
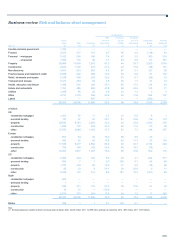
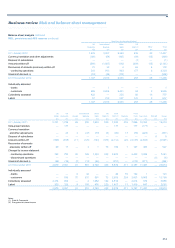
Business review Risk and balance sheet management
304
Balance sheet analysis continued
REIL, provisions and AFS reserves continued
Sector and geographical regional analyses: Core
Credit metrics
REIL Provisions Provisions
Gross as a % of as a % as a % of Impairment Amounts
loans REIL Provisions gross loans of REIL gross loans charge written-off
2013 £m £m £m %% % £m £m
Central and local government 7,490 22 —100 — 2 —
Finance 34,663 393 183 1.1 47 0.5 25 27
Personal - mortgages 146,600 5,815 1,730 4.0 30 1.2 353 328
- unsecured 27,817 2,326 1,876 8.4 81 6.7 371 812
Property 43,170 5,582 2,474 12.9 44 5.7 1,347 465
Construction 5,074 708 417 14.0 59 8.2 163 97
Manufacturing 20,739 544 393 2.6 72 1.9 139 75
Finance leases and instalment credit 10,355 139 89 1.3 64 0.9 23 31
Retail, wholesale and repairs 18,899 827 531 4.4 64 2.8 209 114
Transport and storage 13,927 1,050 432 7.5 41 3.1 402 77
Health, education and leisure 15,481 871 491 5.6 56 3.2 275 82
Hotels and restaurants 6,238 810 474 13.0 59 7.6 155 158
Utilities 4,112 63 43 1.5 68 1.0 65 23
Other 26,469 1,179 800 4.5 68 3.0 229 161
Latent — — 1,389 — — — 23 —
381,034 20,309 11,324 5.3 56 3.0 3,781 2,450
of which:
UK
- residential mortgages 110,515 1,900 319 1.7 17 0.3 38 179
- personal lending 17,074 2,028 1,697 11.9 84 9.9 258 675
- property 34,752 3,103 1,111 8.9 36 3.2 616 405
- construction 4,036 591 330 14.6 56 8.2 123 96
- other 102,412 3,308 2,144 3.2 65 2.1 812 401
Europe
- residential mortgages 17,347 3,136 1,285 18.1 41 7.4 195 26
- personal lending 1,198 133 128 11.1 96 10.7 12 24
- property 3,953 2,441 1,358 61.8 56 34.4 746 52
- construction 378 75 55 19.8 73 14.6 13 —
- other 18,309 2,214 2,168 12.1 98 11.8 730 251
US
- residential mortgages 18,161 760 122 4.2 16 0.7 123 121
- personal lending 8,477 148 34 1.7 23 0.4 84 111
- property 4,058 38 5 0.9 13 0.1 (15) 8
- construction 312 34 24 10.9 71 7.7 27 1
- other 27,722 188 408 0.7 217 1.5 (8) 72
RoW
- residential mortgages 577 19 4 3.3 21 0.7 (3) 2
- personal lending 1,068 17 17 1.6 100 1.6 17 2
- property 407 — — — — — — —
- construction 348 88 2.3 100 2.3 — —
- other 9,930 168 107 1.7 64 1.1 13 24
381,034 20,309 11,324 5.3 56 3.0 3,781 2,450
Banks 27,209 69 62 0.3 90 0.2 (15) 40