RBS 2013 Annual Report Download - page 274
Download and view the complete annual report
Please find page 274 of the 2013 RBS annual report below. You can navigate through the pages in the report by either clicking on the pages listed below, or by using the keyword search tool below to find specific information within the annual report.-
 1
1 -
2
-
3
-
4
-
5
-
6
-
7
-
8
-
9
-
10
-
11
-
12
-
13
-
14
-
15
-
16
-
17
-
18
-
19
-
20
-
21
-
22
-
23
-
24
-
25
-
26
-
27
-
28
-
29
-
30
-
31
-
32
-
33
-
34
-
35
-
36
-
37
-
38
-
39
-
40
-
41
-
42
-
43
-
44
-
45
-
46
-
47
-
48
-
49
-
50
-
51
-
52
-
53
-
54
-
55
-
56
-
57
-
58
-
59
-
60
-
61
-
62
-
63
-
64
-
65
-
66
-
67
-
68
-
69
-
70
-
71
-
72
-
73
-
74
-
75
-
76
-
77
-
78
-
79
-
80
-
81
-
82
-
83
-
84
-
85
-
86
-
87
-
88
-
89
-
90
-
91
-
92
-
93
-
94
-
95
-
96
-
97
-
98
-
99
-
100
-
101
-
102
-
103
-
104
-
105
-
106
-
107
-
108
-
109
-
110
-
111
-
112
-
113
-
114
-
115
-
116
-
117
-
118
-
119
-
120
-
121
-
122
-
123
-
124
-
125
-
126
-
127
-
128
-
129
-
130
-
131
-
132
-
133
-
134
-
135
-
136
-
137
-
138
-
139
-
140
-
141
-
142
-
143
-
144
-
145
-
146
-
147
-
148
-
149
-
150
-
151
-
152
-
153
-
154
-
155
-
156
-
157
-
158
-
159
-
160
-
161
-
162
-
163
-
164
-
165
-
166
-
167
-
168
-
169
-
170
-
171
-
172
-
173
-
174
-
175
-
176
-
177
-
178
-
179
-
180
-
181
-
182
-
183
-
184
-
185
-
186
-
187
-
188
-
189
-
190
-
191
-
192
-
193
-
194
-
195
-
196
-
197
-
198
-
199
-
200
-
201
-
202
-
203
-
204
-
205
-
206
-
207
-
208
-
209
-
210
-
211
-
212
-
213
-
214
-
215
-
216
-
217
-
218
-
219
-
220
-
221
-
222
-
223
-
224
-
225
-
226
-
227
-
228
-
229
-
230
-
231
-
232
-
233
-
234
-
235
-
236
-
237
-
238
-
239
-
240
-
241
-
242
-
243
-
244
-
245
-
246
-
247
-
248
-
249
-
250
-
251
-
252
-
253
-
254
-
255
-
256
-
257
-
258
-
259
-
260
-
261
-
262
-
263
-
 264
264 -
 265
265 -
 266
266 -
 267
267 -
 268
268 -
 269
269 -
 270
270 -
 271
271 -
 272
272 -
 273
273 -
 274
274 -
 275
275 -
 276
276 -
 277
277 -
 278
278 -
 279
279 -
 280
280 -
 281
281 -
 282
282 -
 283
283 -
 284
284 -
285
-
286
-
287
-
288
-
289
-
290
-
291
-
292
-
293
-
294
-
295
-
296
-
297
-
298
-
299
-
300
-
301
-
302
-
303
-
304
-
305
-
306
-
307
-
308
-
309
-
310
-
311
-
312
-
313
-
314
-
315
-
316
-
317
-
318
-
319
-
320
-
321
-
322
-
323
-
324
-
325
-
326
-
327
-
328
-
329
-
330
-
331
-
332
-
333
-
334
-
335
-
336
-
337
-
338
-
339
-
340
-
341
-
342
-
343
-
344
-
345
-
346
-
347
-
348
-
349
-
350
-
351
-
352
-
353
-
354
-
355
-
356
-
357
-
358
-
359
-
360
-
361
-
362
-
363
-
364
-
365
-
366
-
367
-
368
-
369
-
370
-
371
-
372
-
373
-
374
-
375
-
376
-
377
-
378
-
379
-
380
-
381
-
382
-
383
-
384
-
385
-
386
-
387
-
388
-
389
-
390
-
391
-
392
-
393
-
394
-
395
-
396
-
397
-
398
-
399
-
400
-
401
-
402
-
403
-
404
-
405
-
406
-
407
-
408
-
409
-
410
-
411
-
412
-
413
-
414
-
415
-
416
-
417
-
418
-
419
-
420
-
421
-
422
-
423
-
424
-
425
-
426
-
427
-
428
-
429
-
430
-
431
-
432
-
433
-
434
-
435
-
436
-
437
-
438
-
439
-
440
-
441
-
442
-
443
-
444
-
445
-
446
-
447
-
448
-
449
-
450
-
451
-
452
-
453
-
454
-
455
-
456
-
457
-
458
-
459
-
460
-
461
-
462
-
463
-
464
-
465
-
466
-
467
-
468
-
469
-
470
-
471
-
472
-
473
-
474
-
475
-
476
-
477
-
478
-
479
-
480
-
481
-
482
-
483
-
484
-
485
-
486
-
487
-
488
-
489
-
490
-
491
-
492
-
493
-
494
-
495
-
496
-
497
-
498
-
499
-
500
-
501
-
502
-
503
-
504
-
505
-
506
-
507
-
508
-
509
-
510
-
511
-
512
-
513
-
514
-
515
-
516
-
517
-
518
-
519
-
520
-
521
-
522
-
523
-
524
-
525
-
526
-
527
-
528
-
529
-
530
-
531
-
532
-
533
-
534
-
535
-
536
-
537
-
538
-
539
-
540
-
541
-
542
-
543
-
544
-
545
-
546
-
547
-
548
-
549
-
550
-
551
-
552
-
553
-
554
-
555
-
556
-
557
-
558
-
559
-
560
-
561
-
562
-
563
-
564
 |
 |

Business review Risk and balance sheet management
272
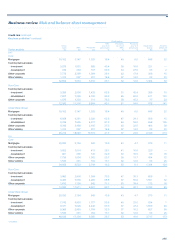
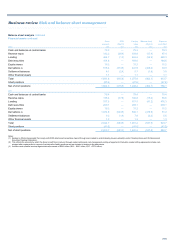
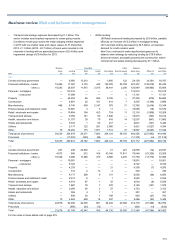
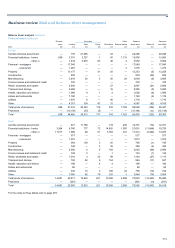
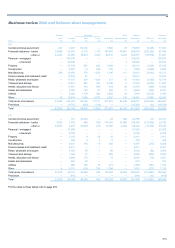
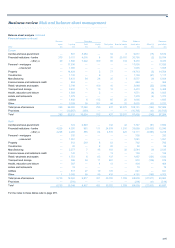
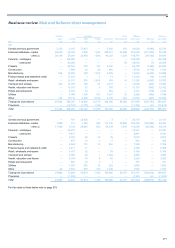
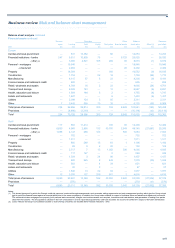
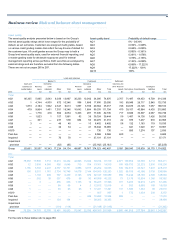
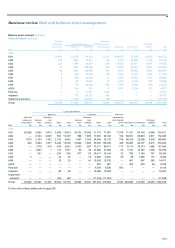
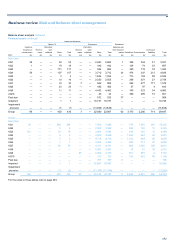
Balance sheet analysis continued
Financial assets continued
Reverse Securities Other Balance Exposure
repos Lending Debt Equity Derivatives financial assets sheet value Offset (1) post offset
2011 £m £m £m £m £m £m £m £m £m
Central and local government 2,247 9,742 125,543 — 5,541 641 143,714 (1,098) 142,616
Financial institutions - banks 39,345 44,080 16,940 2,218 400,261 79,396 582,240 (407,457) 174,783
- other (2) 58,478 51,870 60,628 2,501 98,255 7,451 279,183 (119,717) 159,466
Personal - mortgages — 149,273 — — — — 149,273 — 149,273
- unsecured — 34,424 — — — 52 34,476 (7) 34,469
Property — 81,058 573 175 4,599 1 86,406 (1,274) 85,132
Construction — 9,869 50 53 946 — 10,918 (1,139) 9,779
Manufacturing 254 28,639 664 1,938 3,786 306 35,587 (2,214) 33,373
Finance leases and instalment credit — 14,499 145 2 75 — 14,721 (16) 14,705
Retail, wholesale and repairs — 24,378 645 2,652 1,134 18 28,827 (1,671) 27,156
Transport and storage 436 22,058 539 74 3,759 — 26,866 (241) 26,625
Health, education and leisure — 17,492 310 21 885 — 18,708 (973) 17,735
Hotels and restaurants — 8,870 116 5 671 — 9,662 (184) 9,478
Utilities — 8,406 1,530 554 3,708 30 14,228 (450) 13,778
Other 174 33,490 3,785 5,136 6,437 595 49,617 (1,003) 48,614
Total gross of provisions 100,934 538,148 211,468 15,329 530,057 88,490 1,484,426 (537,444) 946,982
Provisions — (20,674) (2,388) (141) — — (23,203) n/a (23,203)
Total 100,934 517,474 209,080 15,188 530,057 88,490 1,461,223 (537,444) 923,779
For the notes to this table refer to page 278.
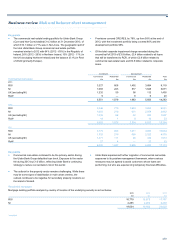
Key points
• Financial asset exposures after offset decreased by £129.4 billion or
16% to £684.3 billion in the year, reflecting the Group’s focus on
reducing its funded balance sheet primarily through ongoing sales in
Non-Core and downsizing of Markets.
• Reductions across securities (debt - £51.0 billion; equity - £6.4
billion), lending (£43.1 billion) reverse repos (£28.4 billion) and
derivatives (£153.9 billion) were partially offset by higher cash
holdings (£3.4 billion). Conditions in the financial markets and the
Group’s continued focus on risk appetite and sector concentrations
resulted in the trends seen.
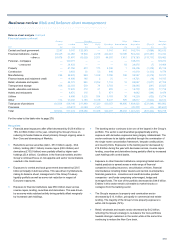
• Exposures to central and local government decreased by £29.5
billion principally in debt securities. This was driven by Markets de-
risking its balance sheet, management of the Group Treasury
liquidity portfolio as well as some risk reduction in respect of
Eurozone exposures.
• Exposure to financial institutions was £59.4 billion lower across
reverse repos, lending, securities and derivatives. This was driven
by economy-wide subdued activity being partially offset marginally
by increased cash holdings.
• The banking sector continues to be one of the largest in the Group’s
portfolio. The sector is well diversified geographically and by
exposure with derivative exposures being largely collateralised. The
sector continues to be tightly controlled through the combination of
the single name concentration framework, bespoke credit policies
and country limits. Exposures to the banking sector decreased by
£14.8 billion during the year with decreases across, reverse repos
lending, securities and derivatives being partially offset by increased
cash holdings with central banks.
• Exposure to other financial institutions comprising traded and non-
traded products is spread across a wide range of financial
companies including insurance, securitisation vehicles, financial
intermediaries including broker dealers and central counterparties,
financial guarantors - monolines and credit derivative product
companies - and funds comprising unleveraged, hedge and
leveraged funds. The size of the portfolio decreased by £44.6 billion.
Entities in this sector remain vulnerable to market shocks or
contagion from the banking sector.
• The Group’s exposure to property and construction sector
decreased by £13.1 billion, principally in commercial real estate
lending. The majority of the Group’s Core property exposure is
within UK Corporate (72%).
• Retail, wholesale and repairs sector decreased by £4.2 billion,
reflecting the Group’s strategy to re-balance the Core portfolios
towards stronger customers in the sector while at the same time
continuing to reduce the Non-Core book.