RBS 2013 Annual Report Download - page 174
Download and view the complete annual report
Please find page 174 of the 2013 RBS annual report below. You can navigate through the pages in the report by either clicking on the pages listed below, or by using the keyword search tool below to find specific information within the annual report.-
 1
1 -
2
-
3
-
4
-
5
-
6
-
7
-
8
-
9
-
10
-
11
-
12
-
13
-
14
-
15
-
16
-
17
-
18
-
19
-
20
-
21
-
22
-
23
-
24
-
25
-
26
-
27
-
28
-
29
-
30
-
31
-
32
-
33
-
34
-
35
-
36
-
37
-
38
-
39
-
40
-
41
-
42
-
43
-
44
-
45
-
46
-
47
-
48
-
49
-
50
-
51
-
52
-
53
-
54
-
55
-
56
-
57
-
58
-
59
-
60
-
61
-
62
-
63
-
64
-
65
-
66
-
67
-
68
-
69
-
70
-
71
-
72
-
73
-
74
-
75
-
76
-
77
-
78
-
79
-
80
-
81
-
82
-
83
-
84
-
85
-
86
-
87
-
88
-
89
-
90
-
91
-
92
-
93
-
94
-
95
-
96
-
97
-
98
-
99
-
100
-
101
-
102
-
103
-
104
-
105
-
106
-
107
-
108
-
109
-
110
-
111
-
112
-
113
-
114
-
115
-
116
-
117
-
118
-
119
-
120
-
121
-
122
-
123
-
124
-
125
-
126
-
127
-
128
-
129
-
130
-
131
-
132
-
133
-
134
-
135
-
136
-
137
-
138
-
139
-
140
-
141
-
142
-
143
-
144
-
145
-
146
-
147
-
148
-
149
-
150
-
151
-
152
-
153
-
154
-
155
-
156
-
157
-
158
-
159
-
160
-
161
-
162
-
163
-
 164
164 -
 165
165 -
 166
166 -
 167
167 -
 168
168 -
 169
169 -
 170
170 -
 171
171 -
 172
172 -
 173
173 -
 174
174 -
 175
175 -
 176
176 -
 177
177 -
 178
178 -
 179
179 -
 180
180 -
 181
181 -
 182
182 -
 183
183 -
 184
184 -
185
-
186
-
187
-
188
-
189
-
190
-
191
-
192
-
193
-
194
-
195
-
196
-
197
-
198
-
199
-
200
-
201
-
202
-
203
-
204
-
205
-
206
-
207
-
208
-
209
-
210
-
211
-
212
-
213
-
214
-
215
-
216
-
217
-
218
-
219
-
220
-
221
-
222
-
223
-
224
-
225
-
226
-
227
-
228
-
229
-
230
-
231
-
232
-
233
-
234
-
235
-
236
-
237
-
238
-
239
-
240
-
241
-
242
-
243
-
244
-
245
-
246
-
247
-
248
-
249
-
250
-
251
-
252
-
253
-
254
-
255
-
256
-
257
-
258
-
259
-
260
-
261
-
262
-
263
-
264
-
265
-
266
-
267
-
268
-
269
-
270
-
271
-
272
-
273
-
274
-
275
-
276
-
277
-
278
-
279
-
280
-
281
-
282
-
283
-
284
-
285
-
286
-
287
-
288
-
289
-
290
-
291
-
292
-
293
-
294
-
295
-
296
-
297
-
298
-
299
-
300
-
301
-
302
-
303
-
304
-
305
-
306
-
307
-
308
-
309
-
310
-
311
-
312
-
313
-
314
-
315
-
316
-
317
-
318
-
319
-
320
-
321
-
322
-
323
-
324
-
325
-
326
-
327
-
328
-
329
-
330
-
331
-
332
-
333
-
334
-
335
-
336
-
337
-
338
-
339
-
340
-
341
-
342
-
343
-
344
-
345
-
346
-
347
-
348
-
349
-
350
-
351
-
352
-
353
-
354
-
355
-
356
-
357
-
358
-
359
-
360
-
361
-
362
-
363
-
364
-
365
-
366
-
367
-
368
-
369
-
370
-
371
-
372
-
373
-
374
-
375
-
376
-
377
-
378
-
379
-
380
-
381
-
382
-
383
-
384
-
385
-
386
-
387
-
388
-
389
-
390
-
391
-
392
-
393
-
394
-
395
-
396
-
397
-
398
-
399
-
400
-
401
-
402
-
403
-
404
-
405
-
406
-
407
-
408
-
409
-
410
-
411
-
412
-
413
-
414
-
415
-
416
-
417
-
418
-
419
-
420
-
421
-
422
-
423
-
424
-
425
-
426
-
427
-
428
-
429
-
430
-
431
-
432
-
433
-
434
-
435
-
436
-
437
-
438
-
439
-
440
-
441
-
442
-
443
-
444
-
445
-
446
-
447
-
448
-
449
-
450
-
451
-
452
-
453
-
454
-
455
-
456
-
457
-
458
-
459
-
460
-
461
-
462
-
463
-
464
-
465
-
466
-
467
-
468
-
469
-
470
-
471
-
472
-
473
-
474
-
475
-
476
-
477
-
478
-
479
-
480
-
481
-
482
-
483
-
484
-
485
-
486
-
487
-
488
-
489
-
490
-
491
-
492
-
493
-
494
-
495
-
496
-
497
-
498
-
499
-
500
-
501
-
502
-
503
-
504
-
505
-
506
-
507
-
508
-
509
-
510
-
511
-
512
-
513
-
514
-
515
-
516
-
517
-
518
-
519
-
520
-
521
-
522
-
523
-
524
-
525
-
526
-
527
-
528
-
529
-
530
-
531
-
532
-
533
-
534
-
535
-
536
-
537
-
538
-
539
-
540
-
541
-
542
-
543
-
544
-
545
-
546
-
547
-
548
-
549
-
550
-
551
-
552
-
553
-
554
-
555
-
556
-
557
-
558
-
559
-
560
-
561
-
562
-
563
-
564
 |
 |

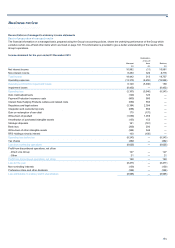
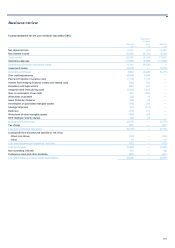
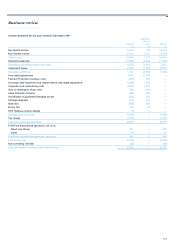
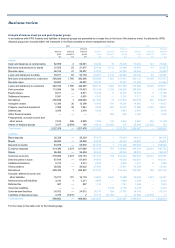
Business review
172
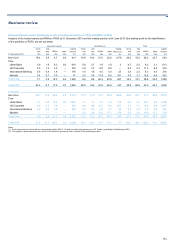
Analysis of balance sheet pre and post disposal groups
In accordance with IFRS 5 assets and liabilities of disposal groups are presented as a single line on the face of the balance sheet. As allowed by IFRS,
disposal groups are included within risk measures in the Risk and balance sheet management section.
2013 2012 2011
Gross of Gross o
f
Gross of
Balance Disposal disposal Balance Disposal disposal Balance Disposal disposal
sheet groups (1) groups sheet groups (2) groups sheet groups (3) groups
£m £m £m £m £m £m £m £m £m
A
ssets
Cash and balances at central banks 82,659 2 82,661 79,290 18 79,308 79,269 127 79,396
Net loans and advances to banks 27,555 22 27,577 29,168 2,112 31,280 43,870 87 43,957
Reverse repos 26,516 41 26,557 34,783 — 34,783 39,440 — 39,440
Loans and advances to banks 54,071 63 54,134 63,951 2,112 66,063 83,310 87 83,397
Net loans and advances to customers 390,825 1,765 392,590 430,088 1,863 431,951 454,112 19,405 473,517
Reverse repos 49,897 — 49,897 70,047 — 70,047 61,494 — 61,494
Loans and advances to customers 440,722 1,765 442,487 500,135 1,863 501,998 515,606 19,405 535,011
Debt securities 113,599 24 113,623 157,438 7,186 164,624 209,080 — 209,080
Equity shares 8,811 — 8,811 15,232 5 15,237 15,183 5 15,188
Settlement balances 5,591 — 5,591 5,741 — 5,741 7,771 14 7,785
Derivatives 288,039 1 288,040 441,903 15 441,918 529,618 439 530,057
Intangible assets 12,368 30 12,398 13,545 750 14,295 14,858 15 14,873
Property, plant and equipment 7,909 32 7,941 9,784 223 10,007 11,868 4,749 16,617
Deferred tax 3,478 1 3,479 3,443 — 3,443 3,878 — 3,878
Other financial assets — — — — 924 924 1,309 — 1,309
Prepayments, accrued income and
other assets 7,614 936 8,550 7,820 742 8,562 9,667 456 10,123
A
ssets of disposal groups 3,017 (2,854) 163 14,013 (13,838) 175 25,450 (25,297) 153
Total assets 1,027,878 — 1,027,878 1,312,295 — 1,312,295 1,506,867 — 1,506,867
Liabilities
Bank deposits 35,329 — 35,329 57,073 1 57,074 69,113 1 69,114
Repos 28,650 — 28,650 44,332 — 44,332 39,691 — 39,691
Deposits by banks 63,979 — 63,979 101,405 1 101,406 108,804 1 108,805
Customer deposits 414,396 3,273 417,669 433,239 753 433,992 414,143 22,610 436,753
Repos 56,484 — 56,484 88,040 — 88,040 88,812 — 88,812
Customer accounts 470,880 3,273 474,153 521,279 753 522,032 502,955 22,610 525,565
Debt securities in issue 67,819 — 67,819 94,592 — 94,592 162,621 — 162,621
Settlement balances 5,313 — 5,313 5,878 — 5,878 7,477 8 7,485
Short positions 28,022 — 28,022 27,591 — 27,591 41,039 — 41,039
Derivatives 285,526 1 285,527 434,333 7 434,340 523,983 126 524,109
A
ccruals, deferred income and
other liabilities 16,017 101 16,118 14,801 2,679 17,480 23,204 1,233 24,437
Retirement benefit liabilities 3,210 1 3,211 3,884 — 3,884 2,239 — 2,239
Deferred tax 507 — 507 1,141 — 1,141 1,945 — 1,945
Insurance liabilities — — — — 6,193 6,193 6,233 — 6,233
Subordinated liabilities 24,012 — 24,012 26,773 529 27,302 26,319 — 26,319
Liabilities of disposal groups 3,378 (3,376) 2 10,170 (10,162) 8 23,995 (23,978) 17
Total liabilities 968,663 — 968,663 1,241,847 — 1,241,847 1,430,814 — 1,430,814
For the notes to this table refer to the following page.