RBS 2013 Annual Report Download - page 117
Download and view the complete annual report
Please find page 117 of the 2013 RBS annual report below. You can navigate through the pages in the report by either clicking on the pages listed below, or by using the keyword search tool below to find specific information within the annual report.-
 1
1 -
2
-
3
-
4
-
5
-
6
-
7
-
8
-
9
-
10
-
11
-
12
-
13
-
14
-
15
-
16
-
17
-
18
-
19
-
20
-
21
-
22
-
23
-
24
-
25
-
26
-
27
-
28
-
29
-
30
-
31
-
32
-
33
-
34
-
35
-
36
-
37
-
38
-
39
-
40
-
41
-
42
-
43
-
44
-
45
-
46
-
47
-
48
-
49
-
50
-
51
-
52
-
53
-
54
-
55
-
56
-
57
-
58
-
59
-
60
-
61
-
62
-
63
-
64
-
65
-
66
-
67
-
68
-
69
-
70
-
71
-
72
-
73
-
74
-
75
-
76
-
77
-
78
-
79
-
80
-
81
-
82
-
83
-
84
-
85
-
86
-
87
-
88
-
89
-
90
-
91
-
92
-
93
-
94
-
95
-
96
-
97
-
98
-
99
-
100
-
101
-
102
-
103
-
104
-
105
-
106
-
 107
107 -
 108
108 -
 109
109 -
 110
110 -
 111
111 -
 112
112 -
 113
113 -
 114
114 -
 115
115 -
 116
116 -
 117
117 -
 118
118 -
 119
119 -
 120
120 -
 121
121 -
 122
122 -
 123
123 -
 124
124 -
 125
125 -
 126
126 -
 127
127 -
128
-
129
-
130
-
131
-
132
-
133
-
134
-
135
-
136
-
137
-
138
-
139
-
140
-
141
-
142
-
143
-
144
-
145
-
146
-
147
-
148
-
149
-
150
-
151
-
152
-
153
-
154
-
155
-
156
-
157
-
158
-
159
-
160
-
161
-
162
-
163
-
164
-
165
-
166
-
167
-
168
-
169
-
170
-
171
-
172
-
173
-
174
-
175
-
176
-
177
-
178
-
179
-
180
-
181
-
182
-
183
-
184
-
185
-
186
-
187
-
188
-
189
-
190
-
191
-
192
-
193
-
194
-
195
-
196
-
197
-
198
-
199
-
200
-
201
-
202
-
203
-
204
-
205
-
206
-
207
-
208
-
209
-
210
-
211
-
212
-
213
-
214
-
215
-
216
-
217
-
218
-
219
-
220
-
221
-
222
-
223
-
224
-
225
-
226
-
227
-
228
-
229
-
230
-
231
-
232
-
233
-
234
-
235
-
236
-
237
-
238
-
239
-
240
-
241
-
242
-
243
-
244
-
245
-
246
-
247
-
248
-
249
-
250
-
251
-
252
-
253
-
254
-
255
-
256
-
257
-
258
-
259
-
260
-
261
-
262
-
263
-
264
-
265
-
266
-
267
-
268
-
269
-
270
-
271
-
272
-
273
-
274
-
275
-
276
-
277
-
278
-
279
-
280
-
281
-
282
-
283
-
284
-
285
-
286
-
287
-
288
-
289
-
290
-
291
-
292
-
293
-
294
-
295
-
296
-
297
-
298
-
299
-
300
-
301
-
302
-
303
-
304
-
305
-
306
-
307
-
308
-
309
-
310
-
311
-
312
-
313
-
314
-
315
-
316
-
317
-
318
-
319
-
320
-
321
-
322
-
323
-
324
-
325
-
326
-
327
-
328
-
329
-
330
-
331
-
332
-
333
-
334
-
335
-
336
-
337
-
338
-
339
-
340
-
341
-
342
-
343
-
344
-
345
-
346
-
347
-
348
-
349
-
350
-
351
-
352
-
353
-
354
-
355
-
356
-
357
-
358
-
359
-
360
-
361
-
362
-
363
-
364
-
365
-
366
-
367
-
368
-
369
-
370
-
371
-
372
-
373
-
374
-
375
-
376
-
377
-
378
-
379
-
380
-
381
-
382
-
383
-
384
-
385
-
386
-
387
-
388
-
389
-
390
-
391
-
392
-
393
-
394
-
395
-
396
-
397
-
398
-
399
-
400
-
401
-
402
-
403
-
404
-
405
-
406
-
407
-
408
-
409
-
410
-
411
-
412
-
413
-
414
-
415
-
416
-
417
-
418
-
419
-
420
-
421
-
422
-
423
-
424
-
425
-
426
-
427
-
428
-
429
-
430
-
431
-
432
-
433
-
434
-
435
-
436
-
437
-
438
-
439
-
440
-
441
-
442
-
443
-
444
-
445
-
446
-
447
-
448
-
449
-
450
-
451
-
452
-
453
-
454
-
455
-
456
-
457
-
458
-
459
-
460
-
461
-
462
-
463
-
464
-
465
-
466
-
467
-
468
-
469
-
470
-
471
-
472
-
473
-
474
-
475
-
476
-
477
-
478
-
479
-
480
-
481
-
482
-
483
-
484
-
485
-
486
-
487
-
488
-
489
-
490
-
491
-
492
-
493
-
494
-
495
-
496
-
497
-
498
-
499
-
500
-
501
-
502
-
503
-
504
-
505
-
506
-
507
-
508
-
509
-
510
-
511
-
512
-
513
-
514
-
515
-
516
-
517
-
518
-
519
-
520
-
521
-
522
-
523
-
524
-
525
-
526
-
527
-
528
-
529
-
530
-
531
-
532
-
533
-
534
-
535
-
536
-
537
-
538
-
539
-
540
-
541
-
542
-
543
-
544
-
545
-
546
-
547
-
548
-
549
-
550
-
551
-
552
-
553
-
554
-
555
-
556
-
557
-
558
-
559
-
560
-
561
-
562
-
563
-
564
 |
 |

Business review
115
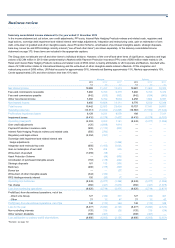
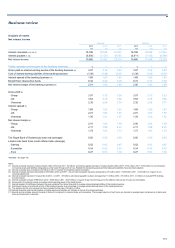
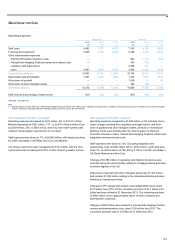
Analysis of results
Net interest income
Managed Statutory
2013 2012* 2011* 2013 2012 2011
£m £m £m £m £m £m
Interest receivable (1,2,3,4,5) 16,706 18,538 21,051 16,706 18,538 21,044
Interest payable (1,3,4) (5,800) (7,127) (8,737) (5,811) (7,142) (8,740)
Net interest income 10,906 11,411 12,314 10,895 11,396 12,304
Yields, spreads and margins of the banking business %% %% % %
Gross yield on interest-earning assets of the banking business (6) 3.07 3.12 3.24 3.07 3.12 3.23
Cost of interest-bearing liabilities of the banking business (1.38) (1.49) (1.63) (1.38) (1.50) (1.62)
Interest spread of the banking business (7) 1.69 1.63 1.61 1.69 1.62 1.61
Benefit from interest-free funds 0.32 0.29 0.28 0.31 0.30 0.28
Net interest margin of the banking business (8) 2.01 1.92 1.89 2.00 1.92 1.89
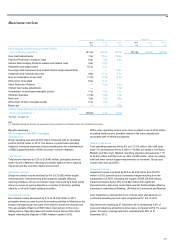
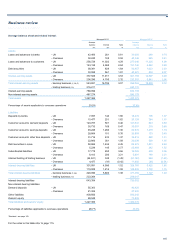
Gross yield (6)
- Group 3.07 3.12 3.24 3.07 3.12 3.23
- UK 3.53 3.48 3.56 3.53 3.48 3.56
- Overseas 2.32 2.56 2.78 2.32 2.56 2.77
Interest spread (7)
- Group 1.69 1.63 1.61 1.69 1.62 1.61
- UK 2.01 1.83 1.87 2.01 1.83 1.87
- Overseas 1.30 1.41 1.27 1.29 1.40 1.26
Net interest margin (8)
- Group 2.01 1.92 1.89 2.00 1.92 1.89
- UK 2.17 1.98 2.01 2.17 1.98 2.01
- Overseas 1.74 1.82 1.73 1.73 1.82 1.72
The Royal Bank of Scotland plc base rate (average) 0.50 0.50 0.50 0.50 0.50 0.50
London inter-bank three month offered rates (average)
- Sterling 0.52 0.82 0.87 0.52 0.82 0.87
- Eurodollar 0.24 0.43 0.33 0.24 0.43 0.33
- Euro 0.27 0.53 1.36 0.27 0.53 1.36
*Restated - see page 102.
Notes:
(1) Interest receivable has been increased by £4 million (2012 and 2011 - £8 million) and interest payable has been increased by £83 million (2012 - £152 million; 2011 - £150 million) to record interest
on financial assets and liabilities designated as at fair value through profit or loss. Related interest-earning assets and interest-bearing liabilities have also been adjusted.
(2) Interest receivable was increased by £2 million in 2011 in respect of exceptional interest receivable.
(3) Interest receivable has been decreased by £38 million (2012 and 2011 - nil) and interest payable has been decreased by £31 million (2012 - £138 million; 2011 - £143 million) in respect of non-
recurring adjustments.
(4) Interest receivable has been increased by nil (2012 - nil; 2011 - £5 million) and interest payable has been decreased by £11 million (2012 - £15 million; 2011 - £3 million) to exclude RFS Holdings
minority interest.
(5) Interest receivable includes £798 million (2012 - £565 million; 2011 - £627 million) in respect of loan fees forming part of the effective interest rate of loans and receivables.
(6) Gross yield is the interest earned on average interest-earning assets of the banking book.
(7) Interest spread is the difference between the gross yield and the interest rate paid on average interest-bearing liabilities of the banking business.
(8) Net interest margin is net interest income of the banking business as a percentage of average interest-earning assets of the banking business.
(9) The analysis into UK and overseas has been compiled on the basis of location of office.
(10) Interest receivable and interest payable on trading assets and liabilities are included in income from trading activities.
(11) Interest income includes amounts (unwind of discount) recognised on impaired loans and receivables. The average balances of such loans are included in average loans and advances to banks and
loans and advances to customers.