RBS 2013 Annual Report Download - page 418
Download and view the complete annual report
Please find page 418 of the 2013 RBS annual report below. You can navigate through the pages in the report by either clicking on the pages listed below, or by using the keyword search tool below to find specific information within the annual report.-
 1
1 -
2
-
3
-
4
-
5
-
6
-
7
-
8
-
9
-
10
-
11
-
12
-
13
-
14
-
15
-
16
-
17
-
18
-
19
-
20
-
21
-
22
-
23
-
24
-
25
-
26
-
27
-
28
-
29
-
30
-
31
-
32
-
33
-
34
-
35
-
36
-
37
-
38
-
39
-
40
-
41
-
42
-
43
-
44
-
45
-
46
-
47
-
48
-
49
-
50
-
51
-
52
-
53
-
54
-
55
-
56
-
57
-
58
-
59
-
60
-
61
-
62
-
63
-
64
-
65
-
66
-
67
-
68
-
69
-
70
-
71
-
72
-
73
-
74
-
75
-
76
-
77
-
78
-
79
-
80
-
81
-
82
-
83
-
84
-
85
-
86
-
87
-
88
-
89
-
90
-
91
-
92
-
93
-
94
-
95
-
96
-
97
-
98
-
99
-
100
-
101
-
102
-
103
-
104
-
105
-
106
-
107
-
108
-
109
-
110
-
111
-
112
-
113
-
114
-
115
-
116
-
117
-
118
-
119
-
120
-
121
-
122
-
123
-
124
-
125
-
126
-
127
-
128
-
129
-
130
-
131
-
132
-
133
-
134
-
135
-
136
-
137
-
138
-
139
-
140
-
141
-
142
-
143
-
144
-
145
-
146
-
147
-
148
-
149
-
150
-
151
-
152
-
153
-
154
-
155
-
156
-
157
-
158
-
159
-
160
-
161
-
162
-
163
-
164
-
165
-
166
-
167
-
168
-
169
-
170
-
171
-
172
-
173
-
174
-
175
-
176
-
177
-
178
-
179
-
180
-
181
-
182
-
183
-
184
-
185
-
186
-
187
-
188
-
189
-
190
-
191
-
192
-
193
-
194
-
195
-
196
-
197
-
198
-
199
-
200
-
201
-
202
-
203
-
204
-
205
-
206
-
207
-
208
-
209
-
210
-
211
-
212
-
213
-
214
-
215
-
216
-
217
-
218
-
219
-
220
-
221
-
222
-
223
-
224
-
225
-
226
-
227
-
228
-
229
-
230
-
231
-
232
-
233
-
234
-
235
-
236
-
237
-
238
-
239
-
240
-
241
-
242
-
243
-
244
-
245
-
246
-
247
-
248
-
249
-
250
-
251
-
252
-
253
-
254
-
255
-
256
-
257
-
258
-
259
-
260
-
261
-
262
-
263
-
264
-
265
-
266
-
267
-
268
-
269
-
270
-
271
-
272
-
273
-
274
-
275
-
276
-
277
-
278
-
279
-
280
-
281
-
282
-
283
-
284
-
285
-
286
-
287
-
288
-
289
-
290
-
291
-
292
-
293
-
294
-
295
-
296
-
297
-
298
-
299
-
300
-
301
-
302
-
303
-
304
-
305
-
306
-
307
-
308
-
309
-
310
-
311
-
312
-
313
-
314
-
315
-
316
-
317
-
318
-
319
-
320
-
321
-
322
-
323
-
324
-
325
-
326
-
327
-
328
-
329
-
330
-
331
-
332
-
333
-
334
-
335
-
336
-
337
-
338
-
339
-
340
-
341
-
342
-
343
-
344
-
345
-
346
-
347
-
348
-
349
-
350
-
351
-
352
-
353
-
354
-
355
-
356
-
357
-
358
-
359
-
360
-
361
-
362
-
363
-
364
-
365
-
366
-
367
-
368
-
369
-
370
-
371
-
372
-
373
-
374
-
375
-
376
-
377
-
378
-
379
-
380
-
381
-
382
-
383
-
384
-
385
-
386
-
387
-
388
-
389
-
390
-
391
-
392
-
393
-
394
-
395
-
396
-
397
-
398
-
399
-
400
-
401
-
402
-
403
-
404
-
405
-
406
-
407
-
 408
408 -
 409
409 -
 410
410 -
 411
411 -
 412
412 -
 413
413 -
 414
414 -
 415
415 -
 416
416 -
 417
417 -
 418
418 -
 419
419 -
 420
420 -
 421
421 -
 422
422 -
 423
423 -
 424
424 -
 425
425 -
 426
426 -
 427
427 -
 428
428 -
429
-
430
-
431
-
432
-
433
-
434
-
435
-
436
-
437
-
438
-
439
-
440
-
441
-
442
-
443
-
444
-
445
-
446
-
447
-
448
-
449
-
450
-
451
-
452
-
453
-
454
-
455
-
456
-
457
-
458
-
459
-
460
-
461
-
462
-
463
-
464
-
465
-
466
-
467
-
468
-
469
-
470
-
471
-
472
-
473
-
474
-
475
-
476
-
477
-
478
-
479
-
480
-
481
-
482
-
483
-
484
-
485
-
486
-
487
-
488
-
489
-
490
-
491
-
492
-
493
-
494
-
495
-
496
-
497
-
498
-
499
-
500
-
501
-
502
-
503
-
504
-
505
-
506
-
507
-
508
-
509
-
510
-
511
-
512
-
513
-
514
-
515
-
516
-
517
-
518
-
519
-
520
-
521
-
522
-
523
-
524
-
525
-
526
-
527
-
528
-
529
-
530
-
531
-
532
-
533
-
534
-
535
-
536
-
537
-
538
-
539
-
540
-
541
-
542
-
543
-
544
-
545
-
546
-
547
-
548
-
549
-
550
-
551
-
552
-
553
-
554
-
555
-
556
-
557
-
558
-
559
-
560
-
561
-
562
-
563
-
564
 |
 |

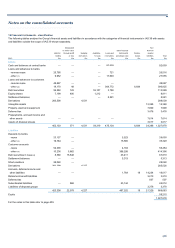
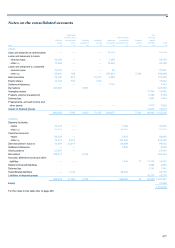
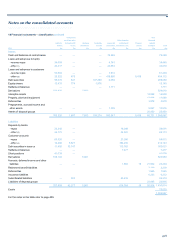
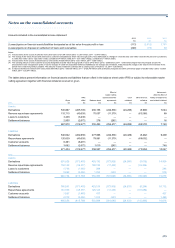
Notes on the consolidated accounts
416
11 Financial instruments - valuation continued
Bid-offer, liquidity and other reserves
Fair value positions are adjusted to bid or offer levels, by marking
individual cash positions directly to bid or offer or by taking bid-offer
reserves calculated on a portfolio basis for derivatives exposures. The
bid-offer approach is based on current market spreads and standard
market bucketing of risk.
Risk data are used as the primary sources of information within bid-offer
calculations and are aggregated when they are more granular than
market standard buckets. Bid-offer adjustments for each risk factor
(including delta (the degree to which the price of an instrument changes
in response to a change in the price of the underlying), vega (the degree
to which the price of an instrument changes in response to the volatility in
the price of the underlying), correlation (the degree to which prices of
different instruments move together)) are determined by aggregating
similar risk exposures arising on different products. Additional basis bid-
offer reserves are taken where these are charged in the market. Risk
associated with non-identical underlying exposures is not netted down
unless there is evidence that the cost of closing the combined risk
exposure is less than the cost of closing on an individual basis.
Bid-offer spreads vary by maturity and risk type to reflect different
spreads in the market. For positions where there is no observable quote,
the bid-offer spreads are widened in comparison to proxies to reflect
reduced liquidity or observability. Bid-offer methodologies may also
incorporate liquidity triggers whereby wider spreads are applied to risks
above pre-defined thresholds.
As permitted by IFRS 13, netting is applied on a portfolio basis to reflect
the value at which the Group believes it could exit the portfolio, rather
than the sum of exit costs for each of the portfolio’s individual trades. This
is applied where the asset and liability positions are managed as a
portfolio for risk and reporting purposes. For example, netting is applied
where long and short risk in two different maturity buckets can be closed
out in a single market transaction at less cost than by way of two
separate transactions (calendar netting). This reflects the fact that to
close down the portfolio, the net risk can be settled rather than each long
and short trade individually.
Vanilla risk on exotic products is typically reserved as part of the overall
portfolio based calculation e.g. delta and vega risk on exotic products are
included within the delta and vega bid-offer calculations. Aggregation of
risk arising from different models is in line with the Group's risk
management practices; the model review control process considers the
appropriateness of model selection in this respect.
Product related risks such as correlation risk, attract specific bid-offer
reserves. Additional reserves are provided for exotic products to ensure
overall reserves match market close-out costs. These market close-out
costs inherently incorporate risk decay and cross-effects (taking into
account how changes in one risk factor may affect other inputs rather
than treating all risk factors independently) that are unlikely to be
adequately reflected in a static hedge based on vanilla instruments.
Where there is limited bid-offer information for a product, the pricing
approach and risk management strategy are taken into account when
assessing the reserve.
The discount rates applied to derivative cash-flows in determining fair
value reflect any underlying collateral agreements. Collateralised
derivatives are generally discounted at the relevant OIS rates at an
individual trade level. Uncollateralised derivatives are discounted with
reference to funding levels by applying a funding spread over benchmark
interest rates on a portfolio basis (funding valuation adjustment).
Funding valuation adjustment (FVA)
Funding valuation adjustments represent an estimate of the adjustment to
fair value that a market participant would make to incorporate funding
costs and benefits that arise in relation to uncollateralised derivative
exposures.
Funding levels are applied to estimated potential future exposures, the
modelling of which is consistent with the approach used in the calculation
of CVA relating to Other counterparties. The counterparty contingent
nature of the exposures is now reflected in the calculation.
Amounts deferred on initial recognition
On initial recognition of financial assets and liabilities valued using
valuation techniques incorporating information other than observable
market data, any difference between the transaction price and that
derived from the valuation technique is deferred. Such amounts are
recognised in profit or loss over the life of the transaction; when market
data becomes observable; or when the transaction matures or is closed
out as appropriate. At 31 December 2013, net gains of £205 million (2012
- £153 million; 2011 - £161 million) were carried forward. During the year,
net gains of £134 million (2012 - £39 million; 2011 - £89 million) were
deferred and £82 million (2012 - £47 million; 2011 - £95 million)
recognised in the income statement.
Own credit
The Group takes into account the effect of its own credit standing when
valuing financial liabilities recorded at fair value in accordance with IFRS.
Own credit spread adjustments are made when valuing issued debt held
at fair value, including issued structured notes, and derivatives. An own
credit adjustment is applied to positions where it is believed that
counterparties would consider the Group's creditworthiness when pricing
trades.
For issued debt and structured notes this adjustment is based on debt
issuance spreads above average inter-bank rates (at a range of tenors).
Secondary senior debt issuance spreads are used in the calculation of
the own credit adjustment applied to senior debt.
The fair value of the Group's derivative financial liabilities has also been
adjusted to reflect the Group's own credit risk (DVA). Expected gains are
applied to estimated potential future negative exposures, the modelling of
which is consistent with the approach used in calculation of CVA relating
to Other counterparties. Expected gains are determined from market
implied probabilities of default and recovery levels. Weightings that were
previously applied in the expected gains calculation were removed during
the period in line with market developments. FVA is also now considered
the primary adjustment applied to derivative liabilities; the extent to which
DVA and FVA overlap is eliminated from DVA.
The own credit adjustment for fair value does not alter cash flows, is not
used for performance management, is disregarded for regulatory capital
reporting processes and will reverse over time as the liabilities mature.