RBS 2013 Annual Report Download - page 518
Download and view the complete annual report
Please find page 518 of the 2013 RBS annual report below. You can navigate through the pages in the report by either clicking on the pages listed below, or by using the keyword search tool below to find specific information within the annual report.-
 1
1 -
2
-
3
-
4
-
5
-
6
-
7
-
8
-
9
-
10
-
11
-
12
-
13
-
14
-
15
-
16
-
17
-
18
-
19
-
20
-
21
-
22
-
23
-
24
-
25
-
26
-
27
-
28
-
29
-
30
-
31
-
32
-
33
-
34
-
35
-
36
-
37
-
38
-
39
-
40
-
41
-
42
-
43
-
44
-
45
-
46
-
47
-
48
-
49
-
50
-
51
-
52
-
53
-
54
-
55
-
56
-
57
-
58
-
59
-
60
-
61
-
62
-
63
-
64
-
65
-
66
-
67
-
68
-
69
-
70
-
71
-
72
-
73
-
74
-
75
-
76
-
77
-
78
-
79
-
80
-
81
-
82
-
83
-
84
-
85
-
86
-
87
-
88
-
89
-
90
-
91
-
92
-
93
-
94
-
95
-
96
-
97
-
98
-
99
-
100
-
101
-
102
-
103
-
104
-
105
-
106
-
107
-
108
-
109
-
110
-
111
-
112
-
113
-
114
-
115
-
116
-
117
-
118
-
119
-
120
-
121
-
122
-
123
-
124
-
125
-
126
-
127
-
128
-
129
-
130
-
131
-
132
-
133
-
134
-
135
-
136
-
137
-
138
-
139
-
140
-
141
-
142
-
143
-
144
-
145
-
146
-
147
-
148
-
149
-
150
-
151
-
152
-
153
-
154
-
155
-
156
-
157
-
158
-
159
-
160
-
161
-
162
-
163
-
164
-
165
-
166
-
167
-
168
-
169
-
170
-
171
-
172
-
173
-
174
-
175
-
176
-
177
-
178
-
179
-
180
-
181
-
182
-
183
-
184
-
185
-
186
-
187
-
188
-
189
-
190
-
191
-
192
-
193
-
194
-
195
-
196
-
197
-
198
-
199
-
200
-
201
-
202
-
203
-
204
-
205
-
206
-
207
-
208
-
209
-
210
-
211
-
212
-
213
-
214
-
215
-
216
-
217
-
218
-
219
-
220
-
221
-
222
-
223
-
224
-
225
-
226
-
227
-
228
-
229
-
230
-
231
-
232
-
233
-
234
-
235
-
236
-
237
-
238
-
239
-
240
-
241
-
242
-
243
-
244
-
245
-
246
-
247
-
248
-
249
-
250
-
251
-
252
-
253
-
254
-
255
-
256
-
257
-
258
-
259
-
260
-
261
-
262
-
263
-
264
-
265
-
266
-
267
-
268
-
269
-
270
-
271
-
272
-
273
-
274
-
275
-
276
-
277
-
278
-
279
-
280
-
281
-
282
-
283
-
284
-
285
-
286
-
287
-
288
-
289
-
290
-
291
-
292
-
293
-
294
-
295
-
296
-
297
-
298
-
299
-
300
-
301
-
302
-
303
-
304
-
305
-
306
-
307
-
308
-
309
-
310
-
311
-
312
-
313
-
314
-
315
-
316
-
317
-
318
-
319
-
320
-
321
-
322
-
323
-
324
-
325
-
326
-
327
-
328
-
329
-
330
-
331
-
332
-
333
-
334
-
335
-
336
-
337
-
338
-
339
-
340
-
341
-
342
-
343
-
344
-
345
-
346
-
347
-
348
-
349
-
350
-
351
-
352
-
353
-
354
-
355
-
356
-
357
-
358
-
359
-
360
-
361
-
362
-
363
-
364
-
365
-
366
-
367
-
368
-
369
-
370
-
371
-
372
-
373
-
374
-
375
-
376
-
377
-
378
-
379
-
380
-
381
-
382
-
383
-
384
-
385
-
386
-
387
-
388
-
389
-
390
-
391
-
392
-
393
-
394
-
395
-
396
-
397
-
398
-
399
-
400
-
401
-
402
-
403
-
404
-
405
-
406
-
407
-
408
-
409
-
410
-
411
-
412
-
413
-
414
-
415
-
416
-
417
-
418
-
419
-
420
-
421
-
422
-
423
-
424
-
425
-
426
-
427
-
428
-
429
-
430
-
431
-
432
-
433
-
434
-
435
-
436
-
437
-
438
-
439
-
440
-
441
-
442
-
443
-
444
-
445
-
446
-
447
-
448
-
449
-
450
-
451
-
452
-
453
-
454
-
455
-
456
-
457
-
458
-
459
-
460
-
461
-
462
-
463
-
464
-
465
-
466
-
467
-
468
-
469
-
470
-
471
-
472
-
473
-
474
-
475
-
476
-
477
-
478
-
479
-
480
-
481
-
482
-
483
-
484
-
485
-
486
-
487
-
488
-
489
-
490
-
491
-
492
-
493
-
494
-
495
-
496
-
497
-
498
-
499
-
500
-
501
-
502
-
503
-
504
-
505
-
506
-
507
-
 508
508 -
 509
509 -
 510
510 -
 511
511 -
 512
512 -
 513
513 -
 514
514 -
 515
515 -
 516
516 -
 517
517 -
 518
518 -
 519
519 -
 520
520 -
 521
521 -
 522
522 -
 523
523 -
 524
524 -
 525
525 -
 526
526 -
 527
527 -
 528
528 -
529
-
530
-
531
-
532
-
533
-
534
-
535
-
536
-
537
-
538
-
539
-
540
-
541
-
542
-
543
-
544
-
545
-
546
-
547
-
548
-
549
-
550
-
551
-
552
-
553
-
554
-
555
-
556
-
557
-
558
-
559
-
560
-
561
-
562
-
563
-
564
 |
 |

Additional information
516
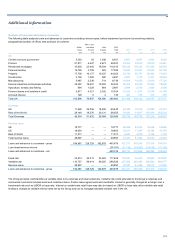
Financial summary continued
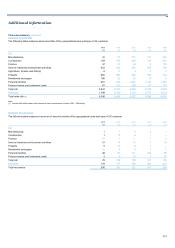
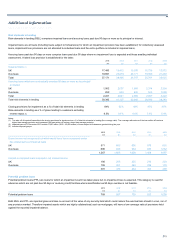
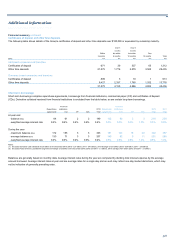
Forbearance
The table below shows loans granted forbearance during the year. These loans are unimpaired: either the loan was performing before and after the
granting of forbearance or the loan was non-performing before but subsequently transferred to the performing book. Loans with impairment provisions
subject to forbearance continue to be reported as impaired loans.
2013 2012 2011 2010 2009
£m £m £m £m £m
Loans granted forbearance 7,901 11,196 7,674 5,758 2,698
Notes:
(1) Wholesale loans subject to forbearance include only those arrangements above thresholds set individually by the divisions, ranging from nil to £3 million.
(2) For 2013, wholesale loans subject to forbearance were £4,305 million (refer to page 244) and secured retail loans subject to forbearance were £3,596 million (refer to page 248). Unsecured retail
loans subject to forbearance are not included. The balance of unsecured retail loans subject to forbearance amounts to £272 million.
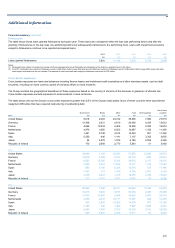
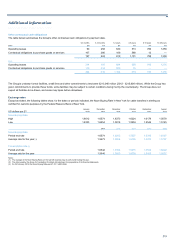
Cross border exposures
Cross border exposures are loans and advances including finance leases and instalment credit receivables and other monetary assets, such as debt
securities, including non-local currency claims of overseas offices on local residents.
The Group monitors the geographical breakdown of these exposures based on the country of domicile of the borrower or guarantor of ultimate risk.
Cross border exposures exclude exposures to local residents in local currencies.
The table below sets out the Group’s cross border exposures greater than 0.5% of the Group’s total assets. None of these countries have experienced
repayment difficulties that have required restructuring of outstanding debt.
Net of short
Government Banks Other Total Short positions positions
2013 £m £m £m £m £m £m
United States 9,016 2,062 24,722 35,800 7,984 27,816
Germany 12,308 2,931 4,819 20,058 4,435 15,623
France 4,686 10,234 4,406 19,326 2,352 16,974
Netherlands 4,979 1,685 6,023 12,687 1,192 11,495
Spain 1,461 5,748 4,814 12,023 801 11,222
Italy 5,350 646 1,141 7,137 3,302 3,835
Japan 34 4,872 1,876 6,782 2,556 4,226
Republic of Ireland 170 2,600 2,773 5,543 51 5,492
2012
United States 18,936 1,736 30,983 51,655 12,080 39,575
Germany 14,678 4,289 6,812 25,779 1,956 23,823
France 6,563 13,285 6,224 26,072 2,157 23,915
Netherlands 5,350 2,227 11,200 18,777 1,124 17,653
Spain 893 4,789 6,328 12,010 515 11,495
Italy 3,767 373 1,165 5,305 2,301 3,004
Japan 4,338 6,822 1,410 12,570 2,326 10,244
Republic of Ireland 217 3,557 3,071 6,845 59 6,786
2011
United States 20,932 7,300 38,721 66,953 13,329 53,624
Germany 34,615 5,952 9,787 50,354 2,946 47,408
France 11,633 14,800 8,189 34,622 5,903 28,719
Netherlands 4,466 2,210 10,711 17,387 982 16,405
Spain 340 3,656 10,282 14,278 973 13,305
Italy 5,190 548 1,489 7,227 4,826 2,401
Japan 8,350 7,505 3,375 19,230 3,141 16,089
Republic of Ireland 665 3,287 2,759 6,711 68 6,643