RBS 2013 Annual Report Download - page 219
Download and view the complete annual report
Please find page 219 of the 2013 RBS annual report below. You can navigate through the pages in the report by either clicking on the pages listed below, or by using the keyword search tool below to find specific information within the annual report.-
 1
1 -
2
-
3
-
4
-
5
-
6
-
7
-
8
-
9
-
10
-
11
-
12
-
13
-
14
-
15
-
16
-
17
-
18
-
19
-
20
-
21
-
22
-
23
-
24
-
25
-
26
-
27
-
28
-
29
-
30
-
31
-
32
-
33
-
34
-
35
-
36
-
37
-
38
-
39
-
40
-
41
-
42
-
43
-
44
-
45
-
46
-
47
-
48
-
49
-
50
-
51
-
52
-
53
-
54
-
55
-
56
-
57
-
58
-
59
-
60
-
61
-
62
-
63
-
64
-
65
-
66
-
67
-
68
-
69
-
70
-
71
-
72
-
73
-
74
-
75
-
76
-
77
-
78
-
79
-
80
-
81
-
82
-
83
-
84
-
85
-
86
-
87
-
88
-
89
-
90
-
91
-
92
-
93
-
94
-
95
-
96
-
97
-
98
-
99
-
100
-
101
-
102
-
103
-
104
-
105
-
106
-
107
-
108
-
109
-
110
-
111
-
112
-
113
-
114
-
115
-
116
-
117
-
118
-
119
-
120
-
121
-
122
-
123
-
124
-
125
-
126
-
127
-
128
-
129
-
130
-
131
-
132
-
133
-
134
-
135
-
136
-
137
-
138
-
139
-
140
-
141
-
142
-
143
-
144
-
145
-
146
-
147
-
148
-
149
-
150
-
151
-
152
-
153
-
154
-
155
-
156
-
157
-
158
-
159
-
160
-
161
-
162
-
163
-
164
-
165
-
166
-
167
-
168
-
169
-
170
-
171
-
172
-
173
-
174
-
175
-
176
-
177
-
178
-
179
-
180
-
181
-
182
-
183
-
184
-
185
-
186
-
187
-
188
-
189
-
190
-
191
-
192
-
193
-
194
-
195
-
196
-
197
-
198
-
199
-
200
-
201
-
202
-
203
-
204
-
205
-
206
-
207
-
208
-
 209
209 -
 210
210 -
 211
211 -
 212
212 -
 213
213 -
 214
214 -
 215
215 -
 216
216 -
 217
217 -
 218
218 -
 219
219 -
 220
220 -
 221
221 -
 222
222 -
 223
223 -
 224
224 -
 225
225 -
 226
226 -
 227
227 -
 228
228 -
 229
229 -
230
-
231
-
232
-
233
-
234
-
235
-
236
-
237
-
238
-
239
-
240
-
241
-
242
-
243
-
244
-
245
-
246
-
247
-
248
-
249
-
250
-
251
-
252
-
253
-
254
-
255
-
256
-
257
-
258
-
259
-
260
-
261
-
262
-
263
-
264
-
265
-
266
-
267
-
268
-
269
-
270
-
271
-
272
-
273
-
274
-
275
-
276
-
277
-
278
-
279
-
280
-
281
-
282
-
283
-
284
-
285
-
286
-
287
-
288
-
289
-
290
-
291
-
292
-
293
-
294
-
295
-
296
-
297
-
298
-
299
-
300
-
301
-
302
-
303
-
304
-
305
-
306
-
307
-
308
-
309
-
310
-
311
-
312
-
313
-
314
-
315
-
316
-
317
-
318
-
319
-
320
-
321
-
322
-
323
-
324
-
325
-
326
-
327
-
328
-
329
-
330
-
331
-
332
-
333
-
334
-
335
-
336
-
337
-
338
-
339
-
340
-
341
-
342
-
343
-
344
-
345
-
346
-
347
-
348
-
349
-
350
-
351
-
352
-
353
-
354
-
355
-
356
-
357
-
358
-
359
-
360
-
361
-
362
-
363
-
364
-
365
-
366
-
367
-
368
-
369
-
370
-
371
-
372
-
373
-
374
-
375
-
376
-
377
-
378
-
379
-
380
-
381
-
382
-
383
-
384
-
385
-
386
-
387
-
388
-
389
-
390
-
391
-
392
-
393
-
394
-
395
-
396
-
397
-
398
-
399
-
400
-
401
-
402
-
403
-
404
-
405
-
406
-
407
-
408
-
409
-
410
-
411
-
412
-
413
-
414
-
415
-
416
-
417
-
418
-
419
-
420
-
421
-
422
-
423
-
424
-
425
-
426
-
427
-
428
-
429
-
430
-
431
-
432
-
433
-
434
-
435
-
436
-
437
-
438
-
439
-
440
-
441
-
442
-
443
-
444
-
445
-
446
-
447
-
448
-
449
-
450
-
451
-
452
-
453
-
454
-
455
-
456
-
457
-
458
-
459
-
460
-
461
-
462
-
463
-
464
-
465
-
466
-
467
-
468
-
469
-
470
-
471
-
472
-
473
-
474
-
475
-
476
-
477
-
478
-
479
-
480
-
481
-
482
-
483
-
484
-
485
-
486
-
487
-
488
-
489
-
490
-
491
-
492
-
493
-
494
-
495
-
496
-
497
-
498
-
499
-
500
-
501
-
502
-
503
-
504
-
505
-
506
-
507
-
508
-
509
-
510
-
511
-
512
-
513
-
514
-
515
-
516
-
517
-
518
-
519
-
520
-
521
-
522
-
523
-
524
-
525
-
526
-
527
-
528
-
529
-
530
-
531
-
532
-
533
-
534
-
535
-
536
-
537
-
538
-
539
-
540
-
541
-
542
-
543
-
544
-
545
-
546
-
547
-
548
-
549
-
550
-
551
-
552
-
553
-
554
-
555
-
556
-
557
-
558
-
559
-
560
-
561
-
562
-
563
-
564
 |
 |

Business review Risk and balance sheet management
217
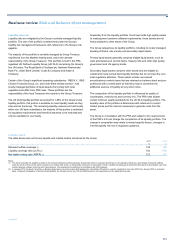
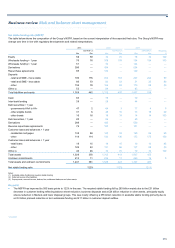
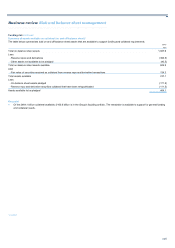
Wholesale funding
The table below summarises funding metrics.
Short-term wholesale funding (1) Total wholesale funding Net inter-bank funding (2)
Excluding Including Excluding Including Net
derivative derivative derivative derivative inter-bank
collateral collateral collateral collateral Deposits Loans (3) funding
£bn £bn £bn £bn £bn £bn £bn
2013 32.4 51.5 108.1 127.2 16.2 (17.3) (1.1)
2012 41.6 70.2 150.4 179.0 28.5 (18.6) 9.9
2011 102.4 134.2 226.2 258.1 37.3 (24.3) 13.0
Notes:
(1) Short-term wholesale balances denote those with a residual maturity of less than one year and include longer-term issuances.
(2) Excludes derivative cash collateral.
(3) Primarily short-term balances.
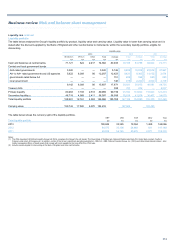
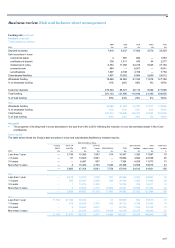
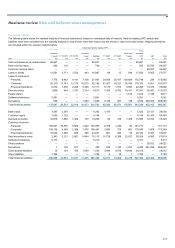
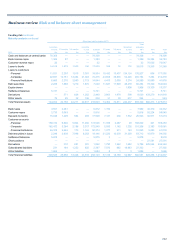
The table below shows the Group’s principal funding sources excluding repurchase agreements.
2013 2012 2011
Less than More than Less than More than Less than More than
1 year 1 year Total 1 year 1 year Total 1 year 1 year Total
£m £m £m £m £m £m £m £m £m
Deposits by banks
derivative cash collateral 19,086 — 19,086 28,585 — 28,585 31,807 — 31,807
other deposits 14,553 1,690 16,243 18,938 9,551 28,489 32,847 4,460 37,307
33,639 1,690 35,329 47,523 9,551 57,074 64,654 4,460 69,114
Debt securities in issue
conduit asset-backed commercial paper (ABCP) — — — — — — 11,164 — 11,164
other commercial paper (CP) 1,583 — 1,583 2,873 — 2,873 5,310 — 5,310
certificates of deposit (CDs) 2,212 65 2,277 2,605 391 2,996 16,086 281 16,367
medium-term notes (MTNs) 10,385 36,779 47,164 13,019 53,584 66,603 36,302 69,407 105,709
covered bonds 1,853 7,188 9,041 1,038 9,101 10,139 — 9,107 9,107
securitisations 514 7,240 7,754 761 11,220 11,981 27 14,937 14,964
16,547 51,272 67,819 20,296 74,296 94,592 68,889 93,732 162,621
Subordinated liabilities 1,350 22,662 24,012 2,351 24,951 27,302 624 25,695 26,319
Notes issued 17,897 73,934 91,831 22,647 99,247 121,894 69,513 119,427 188,940
Wholesale funding 51,536 75,624 127,160 70,170 108,798 178,968 134,167 123,887 258,054
Customer deposits
derivative cash collateral 7,082 — 7,082 7,949 — 7,949 9,242 — 9,242
other deposits 395,520 15,067 410,587 400,012 26,031 426,043 412,931 14,580 427,511
Total customer deposits 402,602 15,067 417,669 407,961 26,031 433,992 422,173 14,580 436,753
Total funding 454,138 90,691 544,829 478,131 134,829 612,960 556,340 138,467 694,807
Key points
• Wholesale funding reduced by nearly 29% in the year to £127 billion
principally reflecting strategic downsizing in Markets.
• Short-term wholesale funding has decreased by £9.2 billion to £32.4
billion reflecting the reduced funding requirement and ongoing
liability management.