RBS 2013 Annual Report Download - page 446
Download and view the complete annual report
Please find page 446 of the 2013 RBS annual report below. You can navigate through the pages in the report by either clicking on the pages listed below, or by using the keyword search tool below to find specific information within the annual report.-
 1
1 -
2
-
3
-
4
-
5
-
6
-
7
-
8
-
9
-
10
-
11
-
12
-
13
-
14
-
15
-
16
-
17
-
18
-
19
-
20
-
21
-
22
-
23
-
24
-
25
-
26
-
27
-
28
-
29
-
30
-
31
-
32
-
33
-
34
-
35
-
36
-
37
-
38
-
39
-
40
-
41
-
42
-
43
-
44
-
45
-
46
-
47
-
48
-
49
-
50
-
51
-
52
-
53
-
54
-
55
-
56
-
57
-
58
-
59
-
60
-
61
-
62
-
63
-
64
-
65
-
66
-
67
-
68
-
69
-
70
-
71
-
72
-
73
-
74
-
75
-
76
-
77
-
78
-
79
-
80
-
81
-
82
-
83
-
84
-
85
-
86
-
87
-
88
-
89
-
90
-
91
-
92
-
93
-
94
-
95
-
96
-
97
-
98
-
99
-
100
-
101
-
102
-
103
-
104
-
105
-
106
-
107
-
108
-
109
-
110
-
111
-
112
-
113
-
114
-
115
-
116
-
117
-
118
-
119
-
120
-
121
-
122
-
123
-
124
-
125
-
126
-
127
-
128
-
129
-
130
-
131
-
132
-
133
-
134
-
135
-
136
-
137
-
138
-
139
-
140
-
141
-
142
-
143
-
144
-
145
-
146
-
147
-
148
-
149
-
150
-
151
-
152
-
153
-
154
-
155
-
156
-
157
-
158
-
159
-
160
-
161
-
162
-
163
-
164
-
165
-
166
-
167
-
168
-
169
-
170
-
171
-
172
-
173
-
174
-
175
-
176
-
177
-
178
-
179
-
180
-
181
-
182
-
183
-
184
-
185
-
186
-
187
-
188
-
189
-
190
-
191
-
192
-
193
-
194
-
195
-
196
-
197
-
198
-
199
-
200
-
201
-
202
-
203
-
204
-
205
-
206
-
207
-
208
-
209
-
210
-
211
-
212
-
213
-
214
-
215
-
216
-
217
-
218
-
219
-
220
-
221
-
222
-
223
-
224
-
225
-
226
-
227
-
228
-
229
-
230
-
231
-
232
-
233
-
234
-
235
-
236
-
237
-
238
-
239
-
240
-
241
-
242
-
243
-
244
-
245
-
246
-
247
-
248
-
249
-
250
-
251
-
252
-
253
-
254
-
255
-
256
-
257
-
258
-
259
-
260
-
261
-
262
-
263
-
264
-
265
-
266
-
267
-
268
-
269
-
270
-
271
-
272
-
273
-
274
-
275
-
276
-
277
-
278
-
279
-
280
-
281
-
282
-
283
-
284
-
285
-
286
-
287
-
288
-
289
-
290
-
291
-
292
-
293
-
294
-
295
-
296
-
297
-
298
-
299
-
300
-
301
-
302
-
303
-
304
-
305
-
306
-
307
-
308
-
309
-
310
-
311
-
312
-
313
-
314
-
315
-
316
-
317
-
318
-
319
-
320
-
321
-
322
-
323
-
324
-
325
-
326
-
327
-
328
-
329
-
330
-
331
-
332
-
333
-
334
-
335
-
336
-
337
-
338
-
339
-
340
-
341
-
342
-
343
-
344
-
345
-
346
-
347
-
348
-
349
-
350
-
351
-
352
-
353
-
354
-
355
-
356
-
357
-
358
-
359
-
360
-
361
-
362
-
363
-
364
-
365
-
366
-
367
-
368
-
369
-
370
-
371
-
372
-
373
-
374
-
375
-
376
-
377
-
378
-
379
-
380
-
381
-
382
-
383
-
384
-
385
-
386
-
387
-
388
-
389
-
390
-
391
-
392
-
393
-
394
-
395
-
396
-
397
-
398
-
399
-
400
-
401
-
402
-
403
-
404
-
405
-
406
-
407
-
408
-
409
-
410
-
411
-
412
-
413
-
414
-
415
-
416
-
417
-
418
-
419
-
420
-
421
-
422
-
423
-
424
-
425
-
426
-
427
-
428
-
429
-
430
-
431
-
432
-
433
-
434
-
435
-
 436
436 -
 437
437 -
 438
438 -
 439
439 -
 440
440 -
 441
441 -
 442
442 -
 443
443 -
 444
444 -
 445
445 -
 446
446 -
 447
447 -
 448
448 -
 449
449 -
 450
450 -
 451
451 -
 452
452 -
 453
453 -
 454
454 -
 455
455 -
 456
456 -
457
-
458
-
459
-
460
-
461
-
462
-
463
-
464
-
465
-
466
-
467
-
468
-
469
-
470
-
471
-
472
-
473
-
474
-
475
-
476
-
477
-
478
-
479
-
480
-
481
-
482
-
483
-
484
-
485
-
486
-
487
-
488
-
489
-
490
-
491
-
492
-
493
-
494
-
495
-
496
-
497
-
498
-
499
-
500
-
501
-
502
-
503
-
504
-
505
-
506
-
507
-
508
-
509
-
510
-
511
-
512
-
513
-
514
-
515
-
516
-
517
-
518
-
519
-
520
-
521
-
522
-
523
-
524
-
525
-
526
-
527
-
528
-
529
-
530
-
531
-
532
-
533
-
534
-
535
-
536
-
537
-
538
-
539
-
540
-
541
-
542
-
543
-
544
-
545
-
546
-
547
-
548
-
549
-
550
-
551
-
552
-
553
-
554
-
555
-
556
-
557
-
558
-
559
-
560
-
561
-
562
-
563
-
564
 |
 |

Notes on the consolidated accounts
444
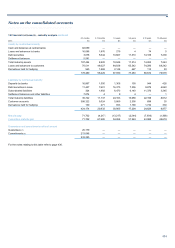
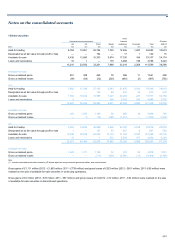
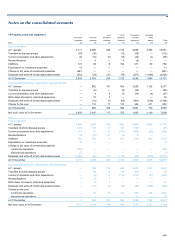
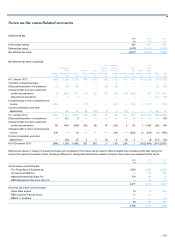
17 Intangible assets continued
Core Other Internally
deposit purchased generated
Goodwill intangibles intangibles software Total
2011 £m £m £m £m £m
Cost
A
t 1 January 27,139 612 2,458 4,575 34,784
Transfers to disposal groups (95) — — — (95)
Currency translation and other adjustments (219) 8 (60) 59 (212)
A
cquisition of subsidiaries 18 — — — 18
A
dditions — — 34 1,050 1,084
Disposals and write-off of fully amortised assets — — — (236) (236)
A
t 31 Decembe
r
26,843 620 2,432 5,448 35,343
A
ccumulated amortisation and impairment
A
t 1 January 14,611 462 1,822 3,441 20,336
Transfers to disposal groups (80) — — — (80)
Currency translation and other adjustments (203) (5) (55) 13 (250)
Disposals and write-off of fully amortised assets — — — (220) (220)
Charge for the year
- continuing operations — 38 184 363 585
- discontinued operations — — — 23 23
Write-down of goodwill and other intangible assets
- continuing operations 80 — — — 80
- discontinued operations 11 — — — 11
A
t 31 Decembe
r
14,419 495 1,951 3,620 20,485
Net book value at 31 December 12,424 125 481 1,828 14,858
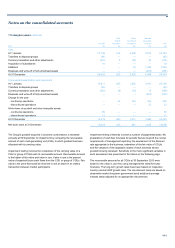
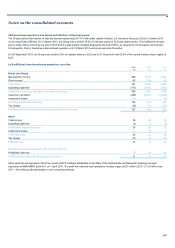
The Group's goodwill acquired in business combinations is reviewed
annually at 30 September for impairment by comparing the recoverable
amount of each cash-generating unit (CGU) to which goodwill has been
allocated with its carrying value.
Impairment testing involves the comparison of the carrying value of a
CGU or group of CGUs with its recoverable amount. Recoverable amount
is the higher of fair value and value in use. Value in use is the present
value of expected future cash flows from the CGU or group of CGUs. Fair
value is the price that would be received to sell an asset in an orderly
transaction between market participants.
Impairment testing inherently involves a number of judgmental areas: the
preparation of cash flow forecasts for periods that are beyond the normal
requirements of management reporting; the assessment of the discount
rate appropriate to the business; estimation of the fair value of CGUs;
and the valuation of the separable assets of each business whose
goodwill is being reviewed. Sensitivity to the more significant variables in
each assessment are presented in the tables on the following page.
The recoverable amounts for all CGUs at 30 September 2013 were
based on the value in use test, using management's latest five-year
forecasts. The long-term growth rates have been based on respective
country nominal GDP growth rates. The risk discount rates are based on
observable market long-term government bond yields and average
industry betas adjusted for an appropriate risk premium.