RBS 2013 Annual Report Download - page 327
Download and view the complete annual report
Please find page 327 of the 2013 RBS annual report below. You can navigate through the pages in the report by either clicking on the pages listed below, or by using the keyword search tool below to find specific information within the annual report.-
 1
1 -
2
-
3
-
4
-
5
-
6
-
7
-
8
-
9
-
10
-
11
-
12
-
13
-
14
-
15
-
16
-
17
-
18
-
19
-
20
-
21
-
22
-
23
-
24
-
25
-
26
-
27
-
28
-
29
-
30
-
31
-
32
-
33
-
34
-
35
-
36
-
37
-
38
-
39
-
40
-
41
-
42
-
43
-
44
-
45
-
46
-
47
-
48
-
49
-
50
-
51
-
52
-
53
-
54
-
55
-
56
-
57
-
58
-
59
-
60
-
61
-
62
-
63
-
64
-
65
-
66
-
67
-
68
-
69
-
70
-
71
-
72
-
73
-
74
-
75
-
76
-
77
-
78
-
79
-
80
-
81
-
82
-
83
-
84
-
85
-
86
-
87
-
88
-
89
-
90
-
91
-
92
-
93
-
94
-
95
-
96
-
97
-
98
-
99
-
100
-
101
-
102
-
103
-
104
-
105
-
106
-
107
-
108
-
109
-
110
-
111
-
112
-
113
-
114
-
115
-
116
-
117
-
118
-
119
-
120
-
121
-
122
-
123
-
124
-
125
-
126
-
127
-
128
-
129
-
130
-
131
-
132
-
133
-
134
-
135
-
136
-
137
-
138
-
139
-
140
-
141
-
142
-
143
-
144
-
145
-
146
-
147
-
148
-
149
-
150
-
151
-
152
-
153
-
154
-
155
-
156
-
157
-
158
-
159
-
160
-
161
-
162
-
163
-
164
-
165
-
166
-
167
-
168
-
169
-
170
-
171
-
172
-
173
-
174
-
175
-
176
-
177
-
178
-
179
-
180
-
181
-
182
-
183
-
184
-
185
-
186
-
187
-
188
-
189
-
190
-
191
-
192
-
193
-
194
-
195
-
196
-
197
-
198
-
199
-
200
-
201
-
202
-
203
-
204
-
205
-
206
-
207
-
208
-
209
-
210
-
211
-
212
-
213
-
214
-
215
-
216
-
217
-
218
-
219
-
220
-
221
-
222
-
223
-
224
-
225
-
226
-
227
-
228
-
229
-
230
-
231
-
232
-
233
-
234
-
235
-
236
-
237
-
238
-
239
-
240
-
241
-
242
-
243
-
244
-
245
-
246
-
247
-
248
-
249
-
250
-
251
-
252
-
253
-
254
-
255
-
256
-
257
-
258
-
259
-
260
-
261
-
262
-
263
-
264
-
265
-
266
-
267
-
268
-
269
-
270
-
271
-
272
-
273
-
274
-
275
-
276
-
277
-
278
-
279
-
280
-
281
-
282
-
283
-
284
-
285
-
286
-
287
-
288
-
289
-
290
-
291
-
292
-
293
-
294
-
295
-
296
-
297
-
298
-
299
-
300
-
301
-
302
-
303
-
304
-
305
-
306
-
307
-
308
-
309
-
310
-
311
-
312
-
313
-
314
-
315
-
316
-
 317
317 -
 318
318 -
 319
319 -
 320
320 -
 321
321 -
 322
322 -
 323
323 -
 324
324 -
 325
325 -
 326
326 -
 327
327 -
 328
328 -
 329
329 -
 330
330 -
 331
331 -
 332
332 -
 333
333 -
 334
334 -
 335
335 -
 336
336 -
 337
337 -
338
-
339
-
340
-
341
-
342
-
343
-
344
-
345
-
346
-
347
-
348
-
349
-
350
-
351
-
352
-
353
-
354
-
355
-
356
-
357
-
358
-
359
-
360
-
361
-
362
-
363
-
364
-
365
-
366
-
367
-
368
-
369
-
370
-
371
-
372
-
373
-
374
-
375
-
376
-
377
-
378
-
379
-
380
-
381
-
382
-
383
-
384
-
385
-
386
-
387
-
388
-
389
-
390
-
391
-
392
-
393
-
394
-
395
-
396
-
397
-
398
-
399
-
400
-
401
-
402
-
403
-
404
-
405
-
406
-
407
-
408
-
409
-
410
-
411
-
412
-
413
-
414
-
415
-
416
-
417
-
418
-
419
-
420
-
421
-
422
-
423
-
424
-
425
-
426
-
427
-
428
-
429
-
430
-
431
-
432
-
433
-
434
-
435
-
436
-
437
-
438
-
439
-
440
-
441
-
442
-
443
-
444
-
445
-
446
-
447
-
448
-
449
-
450
-
451
-
452
-
453
-
454
-
455
-
456
-
457
-
458
-
459
-
460
-
461
-
462
-
463
-
464
-
465
-
466
-
467
-
468
-
469
-
470
-
471
-
472
-
473
-
474
-
475
-
476
-
477
-
478
-
479
-
480
-
481
-
482
-
483
-
484
-
485
-
486
-
487
-
488
-
489
-
490
-
491
-
492
-
493
-
494
-
495
-
496
-
497
-
498
-
499
-
500
-
501
-
502
-
503
-
504
-
505
-
506
-
507
-
508
-
509
-
510
-
511
-
512
-
513
-
514
-
515
-
516
-
517
-
518
-
519
-
520
-
521
-
522
-
523
-
524
-
525
-
526
-
527
-
528
-
529
-
530
-
531
-
532
-
533
-
534
-
535
-
536
-
537
-
538
-
539
-
540
-
541
-
542
-
543
-
544
-
545
-
546
-
547
-
548
-
549
-
550
-
551
-
552
-
553
-
554
-
555
-
556
-
557
-
558
-
559
-
560
-
561
-
562
-
563
-
564
 |
 |

Business review Risk and balance sheet management
325
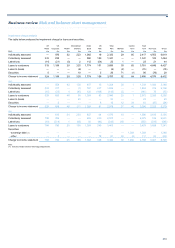
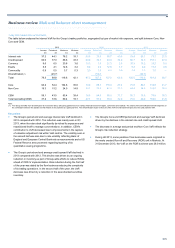
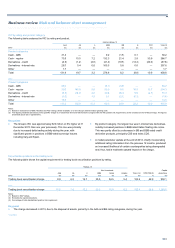
1-day 99% traded internal VaR table
The table below analyses the internal VaR for the Group’s trading portfolios, segregated by type of market risk exposure, and split between Core, Non-
Core and CEM.
2013 2012 2011
Average Period end Maximum Minimum Average Period end Maximum Minimum Average Period end Maximum Minimum
£m £m £m £m £m £m £m £m £m £m £m £m
Interest rate 37.2 44.1 78.2 19.1 62.6 75.6 95.7 40.8 53.4 68.1 79.2 27.5
Credit spread 60.0 37.3 86.8 33.3 69.2 74.1 94.9 44.9 82.7 74.3 151.1 47.4
Currency 8.6 6.5 20.6 3.6 10.3 7.6 21.3 2.6 10.3 16.2 19.2 5.2
Equity 5.8 4.1 12.8 3.2 6.0 3.9 12.5 1.7 9.4 8.0 17.3 4.6
Commodity 0.9 0.5 3.7 0.3 2.0 1.5 6.0 0.9 1.4 2.3 7.0 —
Diversification (1) (23.7) (55.4) (52.3)
Total 79.3 68.8 118.8 42.1 97.3 107.3 137.0 66.5 105.5 116.6 181.3 59.7
Core 64.2 52.4 104.6 35.6 74.6 88.1 118.0 47.4 75.8 89.1 133.9 41.7
Non-Core 19.3 15.2 24.9 14.9 30.1 22.8 41.9 22.0 64.4 34.6 128.6 30.0
CEM 58.1 43.5 85.4 39.4 78.5 84.9 86.0 71.7 50.1 75.8 78.8 30.3
Total (excluding CEM) 37.2 33.6 60.4 19.1 47.1 57.6 76.4 32.2 75.5 49.9 150.0 41.6
Note:
(1) The Group benefits from diversification as it reduces risk by allocating positions across various financial instrument types, currencies and markets. The extent of the diversification benefit depends on
the correlation between the assets and risk factors in the portfolio at a particular time. The diversification factor is the sum of the VaR on individual risk types less the total portfolio VaR.
Key points
• The Group’s period end and average interest rate VaR declined in
2013 compared with 2012. The reduction was mainly seen in Q1
2013, when the rates desk significantly de-risked its exposures and
repositioned itself to manage concentrations. In addition, CEM’s
contribution to VaR decreased due to improvements in the capture
of valuation adjustment risk within VaR metrics. The volatility seen in
the second half was also due to rate volatility reflecting Bank of
England and European Central Bank rate announcements and a US
Federal Reserve announcement regarding tapering of its
quantitative easing programme.
• The Group’s period-end and average credit spread VaR declined in
2013 compared with 2012. This decline was driven by an ongoing
reduction in inventory as part of Group-wide efforts to reduce RWAs
ahead of CRD IV implementation. Risk reduction during the first half
of the year was aided by the flow business reducing the complexity
of its trading operations. In the second half of the year, the VaR
decrease was driven by a reduction in the asset-backed securities
inventory.
• The Group's Core and CEM period end and average VaR declined,
driven by the declines in the interest rate and credit spread VaR.
• The decrease in average and period end Non-Core VaR reflects the
Group's risk reduction strategy.
• During H2 2013, some positions from businesses were migrated to
the newly created Run-off and Recovery (ROR) unit in Markets. At
31 December 2013, the VaR on the ROR business was £6.0 million.