RBS 2013 Annual Report Download - page 122
Download and view the complete annual report
Please find page 122 of the 2013 RBS annual report below. You can navigate through the pages in the report by either clicking on the pages listed below, or by using the keyword search tool below to find specific information within the annual report.-
 1
1 -
2
-
3
-
4
-
5
-
6
-
7
-
8
-
9
-
10
-
11
-
12
-
13
-
14
-
15
-
16
-
17
-
18
-
19
-
20
-
21
-
22
-
23
-
24
-
25
-
26
-
27
-
28
-
29
-
30
-
31
-
32
-
33
-
34
-
35
-
36
-
37
-
38
-
39
-
40
-
41
-
42
-
43
-
44
-
45
-
46
-
47
-
48
-
49
-
50
-
51
-
52
-
53
-
54
-
55
-
56
-
57
-
58
-
59
-
60
-
61
-
62
-
63
-
64
-
65
-
66
-
67
-
68
-
69
-
70
-
71
-
72
-
73
-
74
-
75
-
76
-
77
-
78
-
79
-
80
-
81
-
82
-
83
-
84
-
85
-
86
-
87
-
88
-
89
-
90
-
91
-
92
-
93
-
94
-
95
-
96
-
97
-
98
-
99
-
100
-
101
-
102
-
103
-
104
-
105
-
106
-
107
-
108
-
109
-
110
-
111
-
 112
112 -
 113
113 -
 114
114 -
 115
115 -
 116
116 -
 117
117 -
 118
118 -
 119
119 -
 120
120 -
 121
121 -
 122
122 -
 123
123 -
 124
124 -
 125
125 -
 126
126 -
 127
127 -
 128
128 -
 129
129 -
 130
130 -
 131
131 -
 132
132 -
133
-
134
-
135
-
136
-
137
-
138
-
139
-
140
-
141
-
142
-
143
-
144
-
145
-
146
-
147
-
148
-
149
-
150
-
151
-
152
-
153
-
154
-
155
-
156
-
157
-
158
-
159
-
160
-
161
-
162
-
163
-
164
-
165
-
166
-
167
-
168
-
169
-
170
-
171
-
172
-
173
-
174
-
175
-
176
-
177
-
178
-
179
-
180
-
181
-
182
-
183
-
184
-
185
-
186
-
187
-
188
-
189
-
190
-
191
-
192
-
193
-
194
-
195
-
196
-
197
-
198
-
199
-
200
-
201
-
202
-
203
-
204
-
205
-
206
-
207
-
208
-
209
-
210
-
211
-
212
-
213
-
214
-
215
-
216
-
217
-
218
-
219
-
220
-
221
-
222
-
223
-
224
-
225
-
226
-
227
-
228
-
229
-
230
-
231
-
232
-
233
-
234
-
235
-
236
-
237
-
238
-
239
-
240
-
241
-
242
-
243
-
244
-
245
-
246
-
247
-
248
-
249
-
250
-
251
-
252
-
253
-
254
-
255
-
256
-
257
-
258
-
259
-
260
-
261
-
262
-
263
-
264
-
265
-
266
-
267
-
268
-
269
-
270
-
271
-
272
-
273
-
274
-
275
-
276
-
277
-
278
-
279
-
280
-
281
-
282
-
283
-
284
-
285
-
286
-
287
-
288
-
289
-
290
-
291
-
292
-
293
-
294
-
295
-
296
-
297
-
298
-
299
-
300
-
301
-
302
-
303
-
304
-
305
-
306
-
307
-
308
-
309
-
310
-
311
-
312
-
313
-
314
-
315
-
316
-
317
-
318
-
319
-
320
-
321
-
322
-
323
-
324
-
325
-
326
-
327
-
328
-
329
-
330
-
331
-
332
-
333
-
334
-
335
-
336
-
337
-
338
-
339
-
340
-
341
-
342
-
343
-
344
-
345
-
346
-
347
-
348
-
349
-
350
-
351
-
352
-
353
-
354
-
355
-
356
-
357
-
358
-
359
-
360
-
361
-
362
-
363
-
364
-
365
-
366
-
367
-
368
-
369
-
370
-
371
-
372
-
373
-
374
-
375
-
376
-
377
-
378
-
379
-
380
-
381
-
382
-
383
-
384
-
385
-
386
-
387
-
388
-
389
-
390
-
391
-
392
-
393
-
394
-
395
-
396
-
397
-
398
-
399
-
400
-
401
-
402
-
403
-
404
-
405
-
406
-
407
-
408
-
409
-
410
-
411
-
412
-
413
-
414
-
415
-
416
-
417
-
418
-
419
-
420
-
421
-
422
-
423
-
424
-
425
-
426
-
427
-
428
-
429
-
430
-
431
-
432
-
433
-
434
-
435
-
436
-
437
-
438
-
439
-
440
-
441
-
442
-
443
-
444
-
445
-
446
-
447
-
448
-
449
-
450
-
451
-
452
-
453
-
454
-
455
-
456
-
457
-
458
-
459
-
460
-
461
-
462
-
463
-
464
-
465
-
466
-
467
-
468
-
469
-
470
-
471
-
472
-
473
-
474
-
475
-
476
-
477
-
478
-
479
-
480
-
481
-
482
-
483
-
484
-
485
-
486
-
487
-
488
-
489
-
490
-
491
-
492
-
493
-
494
-
495
-
496
-
497
-
498
-
499
-
500
-
501
-
502
-
503
-
504
-
505
-
506
-
507
-
508
-
509
-
510
-
511
-
512
-
513
-
514
-
515
-
516
-
517
-
518
-
519
-
520
-
521
-
522
-
523
-
524
-
525
-
526
-
527
-
528
-
529
-
530
-
531
-
532
-
533
-
534
-
535
-
536
-
537
-
538
-
539
-
540
-
541
-
542
-
543
-
544
-
545
-
546
-
547
-
548
-
549
-
550
-
551
-
552
-
553
-
554
-
555
-
556
-
557
-
558
-
559
-
560
-
561
-
562
-
563
-
564
 |
 |

Business review
120
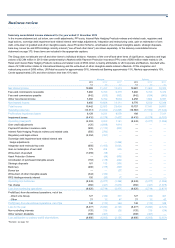
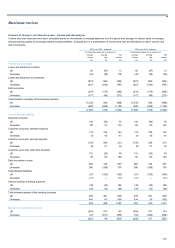
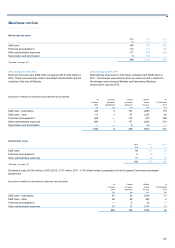
Analysis of change in net interest income - volume and rate analysis
Volume and rate variances have been calculated based on movements in average balances over the period and changes in interest rates on average
interest-earning assets and average interest-bearing liabilities. Changes due to a combination of volume and rate are allocated pro rata to volume and
rate movements.
2013 over 2012 - managed 2013 over 2012 - statutory
Increase/(decrease) due to changes in: Increase/(decrease) due to changes in:
Average Average Net Average Average Net
volume rate change volume rate change
£m £m £m £m £m £m
Interest-earning assets
Loans and advances to banks
UK 60 (47) 13 60 (47) 13
Overseas (44) (32) (76) (44) (32) (76)
Loans and advances to customers
UK (873) 569 (304) (873) 569 (304)
Overseas (267) (530) (797) (267) (530) (797)
Debt securities
UK (219) (176) (395) (219) (176) (395)
Overseas (177) (96) (273) (177) (96) (273)
Total interest receivable of the banking business
UK (1,032) 346 (686) (1,032) 346 (686)
Overseas (488) (658) (1,146) (488) (658) (1,146)
(1,520) (312) (1,832) (1,520) (312) (1,832)
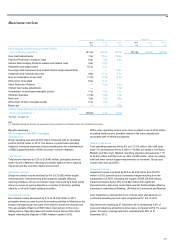
Interest-bearing liabilities
Deposits by banks
UK 144 (92) 52 144 (92) 52
Overseas 80 53 133 82 60 142
Customer accounts: demand deposits
UK (12) 154 142 (12) 154 142
Overseas (4) 45 41 (4) 45 41
Customer accounts: savings deposits
UK (133) 346 213 (133) 346 213
Overseas (9) 41 32 (9) 41 32
Customer accounts: other time deposits
UK 112 (23) 89 112 (23) 89
Overseas 59 89 148 50 93 143
Debt securities in issue
UK 463 124 587 463 124 587
Overseas 366 (169) 197 366 (169) 197
Subordinated liabilities
UK (57) (103) (160) (57) (103) (160)
Overseas (17) — (17) (17) — (17)
Internal funding of trading business
UK (39) (45) (84) (39) (45) (84)
Overseas (34) (12) (46) (34) (12) (46)
Total interest payable of the banking business
UK 478 361 839 478 361 839
Overseas 441 47 488 434 58 492
919 408 1,327 912 419 1,331
Movement in net interest income
UK (554) 707 153 (554) 707 153
Overseas (47) (611) (658) (54) (600) (654)
(601) 96 (505) (608) 107 (501)