RBS 2013 Annual Report Download - page 302
Download and view the complete annual report
Please find page 302 of the 2013 RBS annual report below. You can navigate through the pages in the report by either clicking on the pages listed below, or by using the keyword search tool below to find specific information within the annual report.-
 1
1 -
2
-
3
-
4
-
5
-
6
-
7
-
8
-
9
-
10
-
11
-
12
-
13
-
14
-
15
-
16
-
17
-
18
-
19
-
20
-
21
-
22
-
23
-
24
-
25
-
26
-
27
-
28
-
29
-
30
-
31
-
32
-
33
-
34
-
35
-
36
-
37
-
38
-
39
-
40
-
41
-
42
-
43
-
44
-
45
-
46
-
47
-
48
-
49
-
50
-
51
-
52
-
53
-
54
-
55
-
56
-
57
-
58
-
59
-
60
-
61
-
62
-
63
-
64
-
65
-
66
-
67
-
68
-
69
-
70
-
71
-
72
-
73
-
74
-
75
-
76
-
77
-
78
-
79
-
80
-
81
-
82
-
83
-
84
-
85
-
86
-
87
-
88
-
89
-
90
-
91
-
92
-
93
-
94
-
95
-
96
-
97
-
98
-
99
-
100
-
101
-
102
-
103
-
104
-
105
-
106
-
107
-
108
-
109
-
110
-
111
-
112
-
113
-
114
-
115
-
116
-
117
-
118
-
119
-
120
-
121
-
122
-
123
-
124
-
125
-
126
-
127
-
128
-
129
-
130
-
131
-
132
-
133
-
134
-
135
-
136
-
137
-
138
-
139
-
140
-
141
-
142
-
143
-
144
-
145
-
146
-
147
-
148
-
149
-
150
-
151
-
152
-
153
-
154
-
155
-
156
-
157
-
158
-
159
-
160
-
161
-
162
-
163
-
164
-
165
-
166
-
167
-
168
-
169
-
170
-
171
-
172
-
173
-
174
-
175
-
176
-
177
-
178
-
179
-
180
-
181
-
182
-
183
-
184
-
185
-
186
-
187
-
188
-
189
-
190
-
191
-
192
-
193
-
194
-
195
-
196
-
197
-
198
-
199
-
200
-
201
-
202
-
203
-
204
-
205
-
206
-
207
-
208
-
209
-
210
-
211
-
212
-
213
-
214
-
215
-
216
-
217
-
218
-
219
-
220
-
221
-
222
-
223
-
224
-
225
-
226
-
227
-
228
-
229
-
230
-
231
-
232
-
233
-
234
-
235
-
236
-
237
-
238
-
239
-
240
-
241
-
242
-
243
-
244
-
245
-
246
-
247
-
248
-
249
-
250
-
251
-
252
-
253
-
254
-
255
-
256
-
257
-
258
-
259
-
260
-
261
-
262
-
263
-
264
-
265
-
266
-
267
-
268
-
269
-
270
-
271
-
272
-
273
-
274
-
275
-
276
-
277
-
278
-
279
-
280
-
281
-
282
-
283
-
284
-
285
-
286
-
287
-
288
-
289
-
290
-
291
-
 292
292 -
 293
293 -
 294
294 -
 295
295 -
 296
296 -
 297
297 -
 298
298 -
 299
299 -
 300
300 -
 301
301 -
 302
302 -
 303
303 -
 304
304 -
 305
305 -
 306
306 -
 307
307 -
 308
308 -
 309
309 -
 310
310 -
 311
311 -
 312
312 -
313
-
314
-
315
-
316
-
317
-
318
-
319
-
320
-
321
-
322
-
323
-
324
-
325
-
326
-
327
-
328
-
329
-
330
-
331
-
332
-
333
-
334
-
335
-
336
-
337
-
338
-
339
-
340
-
341
-
342
-
343
-
344
-
345
-
346
-
347
-
348
-
349
-
350
-
351
-
352
-
353
-
354
-
355
-
356
-
357
-
358
-
359
-
360
-
361
-
362
-
363
-
364
-
365
-
366
-
367
-
368
-
369
-
370
-
371
-
372
-
373
-
374
-
375
-
376
-
377
-
378
-
379
-
380
-
381
-
382
-
383
-
384
-
385
-
386
-
387
-
388
-
389
-
390
-
391
-
392
-
393
-
394
-
395
-
396
-
397
-
398
-
399
-
400
-
401
-
402
-
403
-
404
-
405
-
406
-
407
-
408
-
409
-
410
-
411
-
412
-
413
-
414
-
415
-
416
-
417
-
418
-
419
-
420
-
421
-
422
-
423
-
424
-
425
-
426
-
427
-
428
-
429
-
430
-
431
-
432
-
433
-
434
-
435
-
436
-
437
-
438
-
439
-
440
-
441
-
442
-
443
-
444
-
445
-
446
-
447
-
448
-
449
-
450
-
451
-
452
-
453
-
454
-
455
-
456
-
457
-
458
-
459
-
460
-
461
-
462
-
463
-
464
-
465
-
466
-
467
-
468
-
469
-
470
-
471
-
472
-
473
-
474
-
475
-
476
-
477
-
478
-
479
-
480
-
481
-
482
-
483
-
484
-
485
-
486
-
487
-
488
-
489
-
490
-
491
-
492
-
493
-
494
-
495
-
496
-
497
-
498
-
499
-
500
-
501
-
502
-
503
-
504
-
505
-
506
-
507
-
508
-
509
-
510
-
511
-
512
-
513
-
514
-
515
-
516
-
517
-
518
-
519
-
520
-
521
-
522
-
523
-
524
-
525
-
526
-
527
-
528
-
529
-
530
-
531
-
532
-
533
-
534
-
535
-
536
-
537
-
538
-
539
-
540
-
541
-
542
-
543
-
544
-
545
-
546
-
547
-
548
-
549
-
550
-
551
-
552
-
553
-
554
-
555
-
556
-
557
-
558
-
559
-
560
-
561
-
562
-
563
-
564
 |
 |

Business review Risk and balance sheet management
300
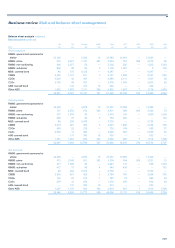
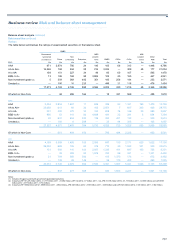
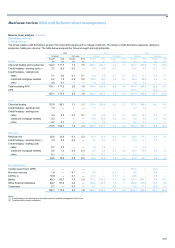
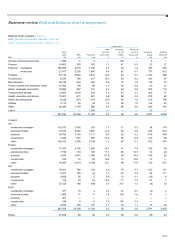
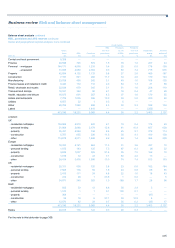
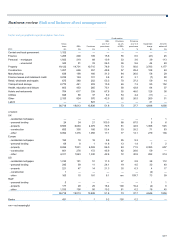
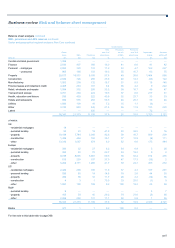
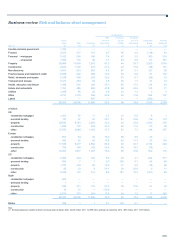
Balance sheet analysis continued
REIL, provisions and AFS reserves continued
Credit metrics
REIL as a % Provisions
Gross loans to of gross loans as a % Impairment Amounts
Banks Customers REIL Provisions to customers of REIL charge written-off
2012 £m £m £m £m % % £m £m
UK Retail 695 113,599 4,569 2,629 4.0 58 529 599
UK Corporate 746 107,025 5,452 2,432 5.1 45 836 514
Wealth 1,545 17,074 248 109 1.5 44 46 15
International Banking 4,827 42,342 422 391 1.0 93 111 445
Ulster Bank 632 32,652 7,533 3,910 23.1 52 1,364 72
US Retail & Commercial 435 51,271 1,146 285 2.2 25 83 391
Retail & Commercial 8,880 363,963 19,370 9,756 5.3 50 2,969 2,036
Markets 16,805 29,787 396 305 1.3 77 25 109
Other 3,196 2,125 — 1 — — 1 —
Core 28,881 395,875 19,766 10,062 5.0 51 2,995 2,145
Non-Core 477 56,343 21,374 11,200 37.9 52 2,320 2,121
Direct Line Group 2,036 881 — — — — — —
Group 31,394 453,099 41,140 21,262 9.1 52 5,315 4,266
2011
UK Retail 628 110,659 4,599 2,679 4.2 58 788 823
UK Corporate 806 110,729 5,001 2,061 4.5 41 790 658
Wealth 2,422 16,913 211 81 1.2 38 25 11
International Banking 3,411 57,729 1,632 851 2.8 52 168 125
Ulster Bank 2,079 34,052 5,523 2,749 16.2 50 1,384 124
US Retail & Commercial 208 51,562 1,007 455 2.0 45 248 373
Retail & Commercial 9,554 381,644 17,973 8,876 4.7 49 3,403 2,114
Markets 29,991 31,490 414 311 1.3 75 — 23
Other 1,270 56 — — — — — —
Core 40,815 413,190 18,387 9,187 4.5 50 3,403 2,137
Non-Core 706 80,005 24,007 11,487 30.0 48 3,838 2,390
Direct Line Group 2,559 873 — — — — — —
Group 44,080 494,068 42,394 20,674 8.6 49 7,241 4,527
Key points
• The Group loan impairment charge for the year increased by 58%
(£3.1 billion) to £8.4 billion from £5.3 billion in 2012. The Core
charge increased 26% (£0.8 billion) to £3.8 billion and the Non-Core
charge increased by 100% (£2.3 billion) to £4.6 billion. £4.5 billion of
the impairment increase was in relation to the creation of RCR and
the related strategy, £1.4 billion in Core and £3.1 billion in Non-Core.
The underlying provision charge decreased £1.4 billion mainly in UK
Retail (£0.2 billion), Ulster Bank residential mortgages (£0.4 billion)
and Non-Core (£0.8 billion), largely due to run down and lower
single name charges in Non-Core.*
• REIL decreased by £1.7 billion to £39.4 billion during the year
mainly in Non-Core (£2.4 billion) and UK Retail (£1.0 billion) offset
by increases in UK Corporate (£0.8 billion) and Ulster Bank (£0.9
billion). REIL reductions in Non-Core primarily related to repayments
and write-offs in UK corporate and International Banking donated
portfolios.
*unaudited
• The RCR provision charge mainly related to loans already within
REIL resulting in an 12% increase in the provision coverage ratio to
64% from 52% at December 2012 while the REIL as a percentage of
total loans increased to 9.4% from 9.1% at 31 December 2012.*
• UK Retail REIL continued to decrease due to the write-off of aged
debt and the transfer of up-to-date mortgages to potential problem
loans. Provision coverage remained broadly stable at 59%.
• REIL in UK Corporate increased 14% mainly driven by individual
cases in the commercial real estate and shipping portfolios as credit
conditions remained difficult in these sectors. The impact of the RCR
related strategy resulted in a £0.4 billion provision increase in Q4
2013.*
• Ulster Bank REIL at £8.5 billion increased by 12% compared with 31
December 2012. The increase in REIL was largely in relation to
commercial real estate investment loans. RCR and related
provisioning in 2013 contributed £0.9 billion to the Core Ulster Bank
provision and has resulted in the provision coverage increasing from
52% to 64% in the year and in the fourth quarter.*