RBS 2013 Annual Report Download - page 447
Download and view the complete annual report
Please find page 447 of the 2013 RBS annual report below. You can navigate through the pages in the report by either clicking on the pages listed below, or by using the keyword search tool below to find specific information within the annual report.-
 1
1 -
2
-
3
-
4
-
5
-
6
-
7
-
8
-
9
-
10
-
11
-
12
-
13
-
14
-
15
-
16
-
17
-
18
-
19
-
20
-
21
-
22
-
23
-
24
-
25
-
26
-
27
-
28
-
29
-
30
-
31
-
32
-
33
-
34
-
35
-
36
-
37
-
38
-
39
-
40
-
41
-
42
-
43
-
44
-
45
-
46
-
47
-
48
-
49
-
50
-
51
-
52
-
53
-
54
-
55
-
56
-
57
-
58
-
59
-
60
-
61
-
62
-
63
-
64
-
65
-
66
-
67
-
68
-
69
-
70
-
71
-
72
-
73
-
74
-
75
-
76
-
77
-
78
-
79
-
80
-
81
-
82
-
83
-
84
-
85
-
86
-
87
-
88
-
89
-
90
-
91
-
92
-
93
-
94
-
95
-
96
-
97
-
98
-
99
-
100
-
101
-
102
-
103
-
104
-
105
-
106
-
107
-
108
-
109
-
110
-
111
-
112
-
113
-
114
-
115
-
116
-
117
-
118
-
119
-
120
-
121
-
122
-
123
-
124
-
125
-
126
-
127
-
128
-
129
-
130
-
131
-
132
-
133
-
134
-
135
-
136
-
137
-
138
-
139
-
140
-
141
-
142
-
143
-
144
-
145
-
146
-
147
-
148
-
149
-
150
-
151
-
152
-
153
-
154
-
155
-
156
-
157
-
158
-
159
-
160
-
161
-
162
-
163
-
164
-
165
-
166
-
167
-
168
-
169
-
170
-
171
-
172
-
173
-
174
-
175
-
176
-
177
-
178
-
179
-
180
-
181
-
182
-
183
-
184
-
185
-
186
-
187
-
188
-
189
-
190
-
191
-
192
-
193
-
194
-
195
-
196
-
197
-
198
-
199
-
200
-
201
-
202
-
203
-
204
-
205
-
206
-
207
-
208
-
209
-
210
-
211
-
212
-
213
-
214
-
215
-
216
-
217
-
218
-
219
-
220
-
221
-
222
-
223
-
224
-
225
-
226
-
227
-
228
-
229
-
230
-
231
-
232
-
233
-
234
-
235
-
236
-
237
-
238
-
239
-
240
-
241
-
242
-
243
-
244
-
245
-
246
-
247
-
248
-
249
-
250
-
251
-
252
-
253
-
254
-
255
-
256
-
257
-
258
-
259
-
260
-
261
-
262
-
263
-
264
-
265
-
266
-
267
-
268
-
269
-
270
-
271
-
272
-
273
-
274
-
275
-
276
-
277
-
278
-
279
-
280
-
281
-
282
-
283
-
284
-
285
-
286
-
287
-
288
-
289
-
290
-
291
-
292
-
293
-
294
-
295
-
296
-
297
-
298
-
299
-
300
-
301
-
302
-
303
-
304
-
305
-
306
-
307
-
308
-
309
-
310
-
311
-
312
-
313
-
314
-
315
-
316
-
317
-
318
-
319
-
320
-
321
-
322
-
323
-
324
-
325
-
326
-
327
-
328
-
329
-
330
-
331
-
332
-
333
-
334
-
335
-
336
-
337
-
338
-
339
-
340
-
341
-
342
-
343
-
344
-
345
-
346
-
347
-
348
-
349
-
350
-
351
-
352
-
353
-
354
-
355
-
356
-
357
-
358
-
359
-
360
-
361
-
362
-
363
-
364
-
365
-
366
-
367
-
368
-
369
-
370
-
371
-
372
-
373
-
374
-
375
-
376
-
377
-
378
-
379
-
380
-
381
-
382
-
383
-
384
-
385
-
386
-
387
-
388
-
389
-
390
-
391
-
392
-
393
-
394
-
395
-
396
-
397
-
398
-
399
-
400
-
401
-
402
-
403
-
404
-
405
-
406
-
407
-
408
-
409
-
410
-
411
-
412
-
413
-
414
-
415
-
416
-
417
-
418
-
419
-
420
-
421
-
422
-
423
-
424
-
425
-
426
-
427
-
428
-
429
-
430
-
431
-
432
-
433
-
434
-
435
-
436
-
 437
437 -
 438
438 -
 439
439 -
 440
440 -
 441
441 -
 442
442 -
 443
443 -
 444
444 -
 445
445 -
 446
446 -
 447
447 -
 448
448 -
 449
449 -
 450
450 -
 451
451 -
 452
452 -
 453
453 -
 454
454 -
 455
455 -
 456
456 -
 457
457 -
458
-
459
-
460
-
461
-
462
-
463
-
464
-
465
-
466
-
467
-
468
-
469
-
470
-
471
-
472
-
473
-
474
-
475
-
476
-
477
-
478
-
479
-
480
-
481
-
482
-
483
-
484
-
485
-
486
-
487
-
488
-
489
-
490
-
491
-
492
-
493
-
494
-
495
-
496
-
497
-
498
-
499
-
500
-
501
-
502
-
503
-
504
-
505
-
506
-
507
-
508
-
509
-
510
-
511
-
512
-
513
-
514
-
515
-
516
-
517
-
518
-
519
-
520
-
521
-
522
-
523
-
524
-
525
-
526
-
527
-
528
-
529
-
530
-
531
-
532
-
533
-
534
-
535
-
536
-
537
-
538
-
539
-
540
-
541
-
542
-
543
-
544
-
545
-
546
-
547
-
548
-
549
-
550
-
551
-
552
-
553
-
554
-
555
-
556
-
557
-
558
-
559
-
560
-
561
-
562
-
563
-
564
 |
 |

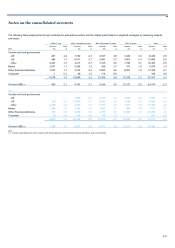
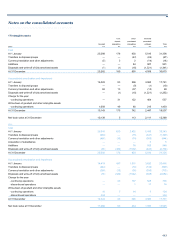
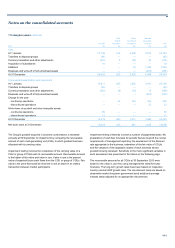
Notes on the consolidated accounts
445
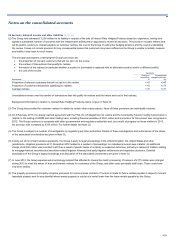
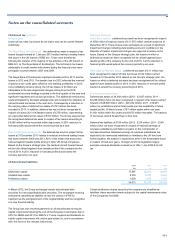
In the light of downward revisions to its forecast financial performance,
goodwill attributable to International Banking (IB) was tested for
impairment as at 31 December 2013: recoverable amount was its value
in use and the discount rate used in the calculation of value in use was
9.5% (30 September 2012 - 12.2%). The results showed IB goodwill in its
entirety was impaired and an impairment loss of £1.1 billion has been
recognised in profit or loss.
The Group will accelerate the divestment of RBS Citizens Financial
Group, the Group’s US banking subsidiary. A partial initial public offering
is now planned for 2014 and the Group intends to fully divest the
business by the end of 2016. Notwithstanding this planned course of
action, the recoverable amount of the US Retail & Commercial CGU
remains its value in use.
Direct Line Group was reclassified as a disposal group in 2012 and its
goodwill was assessed as part of its fair value at 31 December 2012.
The results of the annual impairment test for 2011 are presented using
the Group's 2011 reportable segments which differ as a result of the
changes to the Group’s structure implemented during 2012. The change
in reportable segments in 2012 did not impact the impairment tests
performed in 2011.
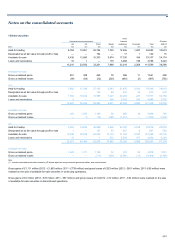
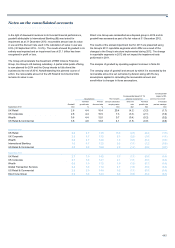
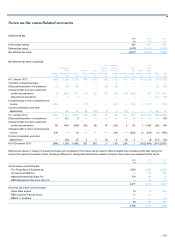
The analysis of goodwill by operating segment is shown in Note 38.
The carrying value of goodwill and amount by which it is exceeded by the
recoverable amount is set out below by division along with the key
assumptions applied in calculating the recoverable amount and
sensitivities to changes in those assumptions.
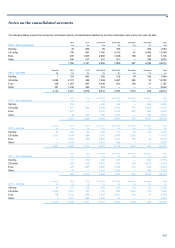
Consequential
Consequential impact of 1% impact of 5%
Assumptions Recoverable adverse movement in adverse movement
Terminal Pre-tax amount exceeded Discount Terminal in forecast
Goodwill growth rate discount rate carrying value rate growth rate pre-tax earnings
September 2013 £bn % % £bn £bn £bn £bn
UK Retail 2.8 4.4 10.4 20.4 (4.2) (3.3) (1.7)
UK Corporate 2.8 4.4 10.5 7.3 (3.3) (2.1) (1.6)
Wealth 0.6 4.4 12.0 0.7 (0.4) (0.3) (0.2)
US Retail & Commercial 3.8 4.8 12.8 4.1 (1.5) (0.8) (0.8)
September 2012
UK Retail 2.8 4.7 13.5 13.8 (2.5) (2.4) (1.3)
UK Corporate 2.8 4.7 13.5 6.3 (2.3) (1.8) (1.4)
Wealth 0.6 4.7 14.8 1.9 (0.5) (0.4) (0.3)
International Banking 1.0 4.7 12.2 0.3 (1.1) (1.2) (0.6)
US Retail & Commercial 3.8 5.3 16.9 2.0 (1.2) (0.8) (0.7)
September 2011
UK Retail 2.7 3.0 14.0 5.5 (1.1) (0.6) (0.8)
UK Corporate 2.7 3.0 14.1 2.1 (1.1) (0.5) (0.8)
Wealth 0.6 3.0 11.0 3.9 (1.0) (0.7) (0.4)
Global Transaction Services 2.4 3.0 11.4 4.7 (1.8) (0.9) (0.6)
US Retail & Commercial 2.8 5.0 14.4 0.2 (1.1) (0.5) (0.6)
Direct Line Group 0.9 3.0 12.3 0.8 (0.5) (0.2) (0.3)