RBS 2013 Annual Report Download - page 196
Download and view the complete annual report
Please find page 196 of the 2013 RBS annual report below. You can navigate through the pages in the report by either clicking on the pages listed below, or by using the keyword search tool below to find specific information within the annual report.-
 1
1 -
2
-
3
-
4
-
5
-
6
-
7
-
8
-
9
-
10
-
11
-
12
-
13
-
14
-
15
-
16
-
17
-
18
-
19
-
20
-
21
-
22
-
23
-
24
-
25
-
26
-
27
-
28
-
29
-
30
-
31
-
32
-
33
-
34
-
35
-
36
-
37
-
38
-
39
-
40
-
41
-
42
-
43
-
44
-
45
-
46
-
47
-
48
-
49
-
50
-
51
-
52
-
53
-
54
-
55
-
56
-
57
-
58
-
59
-
60
-
61
-
62
-
63
-
64
-
65
-
66
-
67
-
68
-
69
-
70
-
71
-
72
-
73
-
74
-
75
-
76
-
77
-
78
-
79
-
80
-
81
-
82
-
83
-
84
-
85
-
86
-
87
-
88
-
89
-
90
-
91
-
92
-
93
-
94
-
95
-
96
-
97
-
98
-
99
-
100
-
101
-
102
-
103
-
104
-
105
-
106
-
107
-
108
-
109
-
110
-
111
-
112
-
113
-
114
-
115
-
116
-
117
-
118
-
119
-
120
-
121
-
122
-
123
-
124
-
125
-
126
-
127
-
128
-
129
-
130
-
131
-
132
-
133
-
134
-
135
-
136
-
137
-
138
-
139
-
140
-
141
-
142
-
143
-
144
-
145
-
146
-
147
-
148
-
149
-
150
-
151
-
152
-
153
-
154
-
155
-
156
-
157
-
158
-
159
-
160
-
161
-
162
-
163
-
164
-
165
-
166
-
167
-
168
-
169
-
170
-
171
-
172
-
173
-
174
-
175
-
176
-
177
-
178
-
179
-
180
-
181
-
182
-
183
-
184
-
185
-
 186
186 -
 187
187 -
 188
188 -
 189
189 -
 190
190 -
 191
191 -
 192
192 -
 193
193 -
 194
194 -
 195
195 -
 196
196 -
 197
197 -
 198
198 -
 199
199 -
 200
200 -
 201
201 -
 202
202 -
 203
203 -
 204
204 -
 205
205 -
 206
206 -
207
-
208
-
209
-
210
-
211
-
212
-
213
-
214
-
215
-
216
-
217
-
218
-
219
-
220
-
221
-
222
-
223
-
224
-
225
-
226
-
227
-
228
-
229
-
230
-
231
-
232
-
233
-
234
-
235
-
236
-
237
-
238
-
239
-
240
-
241
-
242
-
243
-
244
-
245
-
246
-
247
-
248
-
249
-
250
-
251
-
252
-
253
-
254
-
255
-
256
-
257
-
258
-
259
-
260
-
261
-
262
-
263
-
264
-
265
-
266
-
267
-
268
-
269
-
270
-
271
-
272
-
273
-
274
-
275
-
276
-
277
-
278
-
279
-
280
-
281
-
282
-
283
-
284
-
285
-
286
-
287
-
288
-
289
-
290
-
291
-
292
-
293
-
294
-
295
-
296
-
297
-
298
-
299
-
300
-
301
-
302
-
303
-
304
-
305
-
306
-
307
-
308
-
309
-
310
-
311
-
312
-
313
-
314
-
315
-
316
-
317
-
318
-
319
-
320
-
321
-
322
-
323
-
324
-
325
-
326
-
327
-
328
-
329
-
330
-
331
-
332
-
333
-
334
-
335
-
336
-
337
-
338
-
339
-
340
-
341
-
342
-
343
-
344
-
345
-
346
-
347
-
348
-
349
-
350
-
351
-
352
-
353
-
354
-
355
-
356
-
357
-
358
-
359
-
360
-
361
-
362
-
363
-
364
-
365
-
366
-
367
-
368
-
369
-
370
-
371
-
372
-
373
-
374
-
375
-
376
-
377
-
378
-
379
-
380
-
381
-
382
-
383
-
384
-
385
-
386
-
387
-
388
-
389
-
390
-
391
-
392
-
393
-
394
-
395
-
396
-
397
-
398
-
399
-
400
-
401
-
402
-
403
-
404
-
405
-
406
-
407
-
408
-
409
-
410
-
411
-
412
-
413
-
414
-
415
-
416
-
417
-
418
-
419
-
420
-
421
-
422
-
423
-
424
-
425
-
426
-
427
-
428
-
429
-
430
-
431
-
432
-
433
-
434
-
435
-
436
-
437
-
438
-
439
-
440
-
441
-
442
-
443
-
444
-
445
-
446
-
447
-
448
-
449
-
450
-
451
-
452
-
453
-
454
-
455
-
456
-
457
-
458
-
459
-
460
-
461
-
462
-
463
-
464
-
465
-
466
-
467
-
468
-
469
-
470
-
471
-
472
-
473
-
474
-
475
-
476
-
477
-
478
-
479
-
480
-
481
-
482
-
483
-
484
-
485
-
486
-
487
-
488
-
489
-
490
-
491
-
492
-
493
-
494
-
495
-
496
-
497
-
498
-
499
-
500
-
501
-
502
-
503
-
504
-
505
-
506
-
507
-
508
-
509
-
510
-
511
-
512
-
513
-
514
-
515
-
516
-
517
-
518
-
519
-
520
-
521
-
522
-
523
-
524
-
525
-
526
-
527
-
528
-
529
-
530
-
531
-
532
-
533
-
534
-
535
-
536
-
537
-
538
-
539
-
540
-
541
-
542
-
543
-
544
-
545
-
546
-
547
-
548
-
549
-
550
-
551
-
552
-
553
-
554
-
555
-
556
-
557
-
558
-
559
-
560
-
561
-
562
-
563
-
564
 |
 |

Business review Risk and balance sheet management
194
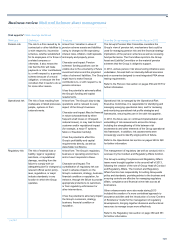
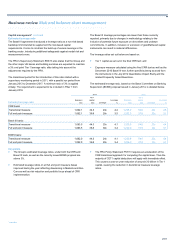
Capital management* continued
Governance continued
Determining appropriate capital
The Group’s own determination of sufficient capital is derived from the
desired credit rating, risk appetite and reflects the current and emerging
regulatory requirements of the Group. It is evaluated through both
internally and externally defined stress testing to identify potential
changes in capital ratios in a range of scenarios.
Basel II requires RWAs to be calculated for credit, market and operational
risk with various approaches available to banks, with differing levels of
sophistication. The minimum capital requirement is calculated as 8% of
RWAs.
The Group identifies the management and recovery actions that could be
applied in stress environments. These form an important part of the
capital management approach and the contingency planning
arrangements, complementing the established buffers.
Monitoring and maintenance
Based on these determinations, which are continually reassessed, the
Group aims to maintain capital adequacy, both at Group level and in each
regulated entity.
The Group operates a rigorous capital planning process aimed at
ensuring the capital position is controlled within the agreed parameters.
This incorporates regular re-forecasts of the capital positions of the
regulated entities and the overall Group. In the event that the projected
position might deteriorate beyond acceptable levels, the Group would
issue further capital and/or revise business plans accordingly.
Stress testing approaches are used to determine the level of capital
required to ensure the Group expects to remain adequately capitalised.
Minimising surplus profits and capital
The Group has a process in place which requires surplus distributable
profits of all Group subsidiaries, after making allowance for sufficient
capital to support current and prospective growth in the following half-
year, to be repatriated by way of a dividend on a half yearly basis and
paid in cash before the period end. Surplus is defined as subsidiary
capital of more than £1 million in excess of the regulatory minimum for
UK banks and in accordance with the Group's policy, including capital
buffers, or the industry specific/overseas regulatory requirements.
However, fungibility of capital is subject to the approval of the local
regulator.
*unaudited
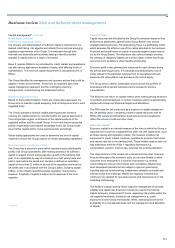
Capital allocation
Capital resources are allocated to the Group’s businesses based on key
performance parameters agreed by the Group Board in the annual
strategic planning process. Principal among these is a profitability metric,
which assesses the effective use of the capital allocated to the business.
Projected and actual return on equity is assessed against target returns
set by the Group Board. The allocations also reflect strategic priorities,
the intensity of regulatory capital use and the usage of other key Group
resources such as balance sheet liquidity and funding.
Economic profit is also planned and measured for each division during
the annual planning process. It is calculated by deducting the cost of
equity utilised in the particular business from its operating profit and
measures the value added over and above the cost of equity.
The Group aims to deliver sustainable returns across the portfolio of
businesses with projected business returns stressed to test key
vulnerabilities.
The divisions use return on capital metrics when making pricing decisions
on products and transactions, to ensure customer activity is appropriately
aligned with Group and divisional targets and allocations.
The PRA uses the risk asset ratio as a measure of capital adequacy in
the UK banking sector, comparing a bank’s capital resources with its
RWAs (the assets and off-balance sheet exposures are weighted to
reflect the inherent credit and other risks).
Economic capital
Economic capital is an internal measure of the risks to which the Group is
exposed and is used as a supplement to other risk and capital tools, such
as stress testing and regulatory capital. The measure includes risk
exposures for credit, market, business, operational, pension, fixed asset
and interest rate risk in the banking book. These models capture risks not
fully addressed within the Pillar 1 regulatory framework e.g.
concentration, pension, interest rate, business risk and diversification.
The characteristics of the models are consistent across risks, business
lines and throughout the economic cycle, but are also flexible to allow
outcomes to be employed for a number of purposes e.g. severity
level/confidence interval, time horizon and correlations. Models have
been developed internally but are subject to rigorous governance
including external benchmarking, independent validation and extensive
internal review and challenge. Models are regularly reviewed and
continue to be updated for new data sources and improvements in risk
modelling methodology.
The ability to change severity levels supports management of earnings
volatility and capital risk. Economic models are used in the Internal
Capital Adequacy Assessment Process, assessing risk profiles within the
risk appetite framework, functional risk management e.g. credit
exposures at both Group and business levels, assessing business line
profitability on a risk adjusted basis and the management and allocation
of capital.