RBS 2013 Annual Report Download - page 361
Download and view the complete annual report
Please find page 361 of the 2013 RBS annual report below. You can navigate through the pages in the report by either clicking on the pages listed below, or by using the keyword search tool below to find specific information within the annual report.-
 1
1 -
2
-
3
-
4
-
5
-
6
-
7
-
8
-
9
-
10
-
11
-
12
-
13
-
14
-
15
-
16
-
17
-
18
-
19
-
20
-
21
-
22
-
23
-
24
-
25
-
26
-
27
-
28
-
29
-
30
-
31
-
32
-
33
-
34
-
35
-
36
-
37
-
38
-
39
-
40
-
41
-
42
-
43
-
44
-
45
-
46
-
47
-
48
-
49
-
50
-
51
-
52
-
53
-
54
-
55
-
56
-
57
-
58
-
59
-
60
-
61
-
62
-
63
-
64
-
65
-
66
-
67
-
68
-
69
-
70
-
71
-
72
-
73
-
74
-
75
-
76
-
77
-
78
-
79
-
80
-
81
-
82
-
83
-
84
-
85
-
86
-
87
-
88
-
89
-
90
-
91
-
92
-
93
-
94
-
95
-
96
-
97
-
98
-
99
-
100
-
101
-
102
-
103
-
104
-
105
-
106
-
107
-
108
-
109
-
110
-
111
-
112
-
113
-
114
-
115
-
116
-
117
-
118
-
119
-
120
-
121
-
122
-
123
-
124
-
125
-
126
-
127
-
128
-
129
-
130
-
131
-
132
-
133
-
134
-
135
-
136
-
137
-
138
-
139
-
140
-
141
-
142
-
143
-
144
-
145
-
146
-
147
-
148
-
149
-
150
-
151
-
152
-
153
-
154
-
155
-
156
-
157
-
158
-
159
-
160
-
161
-
162
-
163
-
164
-
165
-
166
-
167
-
168
-
169
-
170
-
171
-
172
-
173
-
174
-
175
-
176
-
177
-
178
-
179
-
180
-
181
-
182
-
183
-
184
-
185
-
186
-
187
-
188
-
189
-
190
-
191
-
192
-
193
-
194
-
195
-
196
-
197
-
198
-
199
-
200
-
201
-
202
-
203
-
204
-
205
-
206
-
207
-
208
-
209
-
210
-
211
-
212
-
213
-
214
-
215
-
216
-
217
-
218
-
219
-
220
-
221
-
222
-
223
-
224
-
225
-
226
-
227
-
228
-
229
-
230
-
231
-
232
-
233
-
234
-
235
-
236
-
237
-
238
-
239
-
240
-
241
-
242
-
243
-
244
-
245
-
246
-
247
-
248
-
249
-
250
-
251
-
252
-
253
-
254
-
255
-
256
-
257
-
258
-
259
-
260
-
261
-
262
-
263
-
264
-
265
-
266
-
267
-
268
-
269
-
270
-
271
-
272
-
273
-
274
-
275
-
276
-
277
-
278
-
279
-
280
-
281
-
282
-
283
-
284
-
285
-
286
-
287
-
288
-
289
-
290
-
291
-
292
-
293
-
294
-
295
-
296
-
297
-
298
-
299
-
300
-
301
-
302
-
303
-
304
-
305
-
306
-
307
-
308
-
309
-
310
-
311
-
312
-
313
-
314
-
315
-
316
-
317
-
318
-
319
-
320
-
321
-
322
-
323
-
324
-
325
-
326
-
327
-
328
-
329
-
330
-
331
-
332
-
333
-
334
-
335
-
336
-
337
-
338
-
339
-
340
-
341
-
342
-
343
-
344
-
345
-
346
-
347
-
348
-
349
-
350
-
 351
351 -
 352
352 -
 353
353 -
 354
354 -
 355
355 -
 356
356 -
 357
357 -
 358
358 -
 359
359 -
 360
360 -
 361
361 -
 362
362 -
 363
363 -
 364
364 -
 365
365 -
 366
366 -
 367
367 -
 368
368 -
 369
369 -
 370
370 -
 371
371 -
372
-
373
-
374
-
375
-
376
-
377
-
378
-
379
-
380
-
381
-
382
-
383
-
384
-
385
-
386
-
387
-
388
-
389
-
390
-
391
-
392
-
393
-
394
-
395
-
396
-
397
-
398
-
399
-
400
-
401
-
402
-
403
-
404
-
405
-
406
-
407
-
408
-
409
-
410
-
411
-
412
-
413
-
414
-
415
-
416
-
417
-
418
-
419
-
420
-
421
-
422
-
423
-
424
-
425
-
426
-
427
-
428
-
429
-
430
-
431
-
432
-
433
-
434
-
435
-
436
-
437
-
438
-
439
-
440
-
441
-
442
-
443
-
444
-
445
-
446
-
447
-
448
-
449
-
450
-
451
-
452
-
453
-
454
-
455
-
456
-
457
-
458
-
459
-
460
-
461
-
462
-
463
-
464
-
465
-
466
-
467
-
468
-
469
-
470
-
471
-
472
-
473
-
474
-
475
-
476
-
477
-
478
-
479
-
480
-
481
-
482
-
483
-
484
-
485
-
486
-
487
-
488
-
489
-
490
-
491
-
492
-
493
-
494
-
495
-
496
-
497
-
498
-
499
-
500
-
501
-
502
-
503
-
504
-
505
-
506
-
507
-
508
-
509
-
510
-
511
-
512
-
513
-
514
-
515
-
516
-
517
-
518
-
519
-
520
-
521
-
522
-
523
-
524
-
525
-
526
-
527
-
528
-
529
-
530
-
531
-
532
-
533
-
534
-
535
-
536
-
537
-
538
-
539
-
540
-
541
-
542
-
543
-
544
-
545
-
546
-
547
-
548
-
549
-
550
-
551
-
552
-
553
-
554
-
555
-
556
-
557
-
558
-
559
-
560
-
561
-
562
-
563
-
564
 |
 |
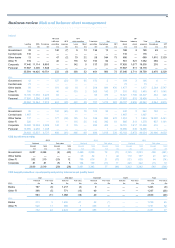
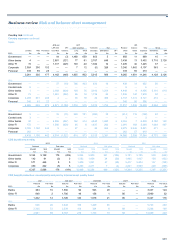
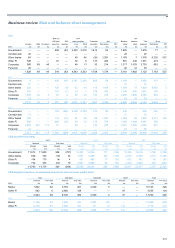
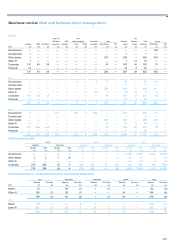
Business review Risk and balance sheet management
359
Risk measurement
Scenario analysis is used to assess the impact of extreme but plausible
operational risks. It provides a forward-looking basis for managing risk
exposures, with a structured and consistent approach to scenario scoping
and measurement. In 2013, the portfolio of scenarios was further
enhanced with greater coverage of the material risks to which the Group
is exposed.
Scenario analysis is an important component in the operational risk
framework, providing senior management with valuable insight into risk
exposures that could significantly affect the Group’s financial
performance or reputation. Scenarios also provide an important link
between operational risk management and measurement as a key input
into the calculation of Economic Capital, and into the Group’s stress
testing and reverse stress testing processes.
Scenarios are run in a workshop environment, bringing business and risk
and control experts together, thereby providing a deeper understanding
of risk exposures and allowing management to make more informed
decisions on taking action.
The Group further refined its approach to assessing the impact of the
economic cycle on its operational risk losses by specifically assessing the
impact of the PRA’s published Anchor 5 scenario, which describes the
impact of a series of country-specific shocks around the world on
expected levels of operational risk losses and capital adequacy
requirements for operational risk.
The impact of the PRA Anchor 5 scenario on the Group's operational risk
capital, as calculated under the standardised approach, was also
projected based on the outputs of the Group’s stress-testing exercises.
Operational risk impacts are also assessed based on additional economic
stress scenarios developed internally. This is used as part of the overall
stress input to capital planning and ICAAP.
Operational risk is measured utilising a top-down assessment of risk
through scenario analysis along with a bottom-up assessment of risk and
controls.
Scenario analysis is the frequency and impact assessment of extreme
but plausible operational risk exposures, which assess the Group’s
vulnerability against future unexpected loss. Scenarios, along with
internal and external loss data, are a key input into the capital model and
are expected to influence the capital outcome significantly as they drive
the tail of the severity distribution.
Risk and control assessments examine the financial and non-financial
risk impact. The risk impact is assessed on both an expected and
exceptional loss basis for the following 12-month period, and a risk
appetite decision made.
*unaudited
Event and loss data management
Event and loss data management covers a set of standard requirements
for the management of operational risk events and loss data. It also
provides for clear and consistent communication of operational risk
events that meet defined threshold criteria to the Group’s senior
management. The Group has continued to focus on the timely and
accurate capture of operational risk losses; the use of a single Group-
wide repository; and the escalation of material operational risk events.
All losses and recoveries associated with an operational risk event are
reported based on the date of each financial impact. A single event can
have multiple losses (or recoveries) which may take some time to
crystallise. Losses and recoveries will also have been booked in 2013 on
events which occurred, or were identified in, prior years.
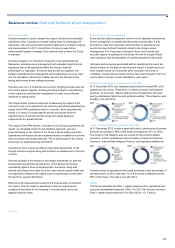
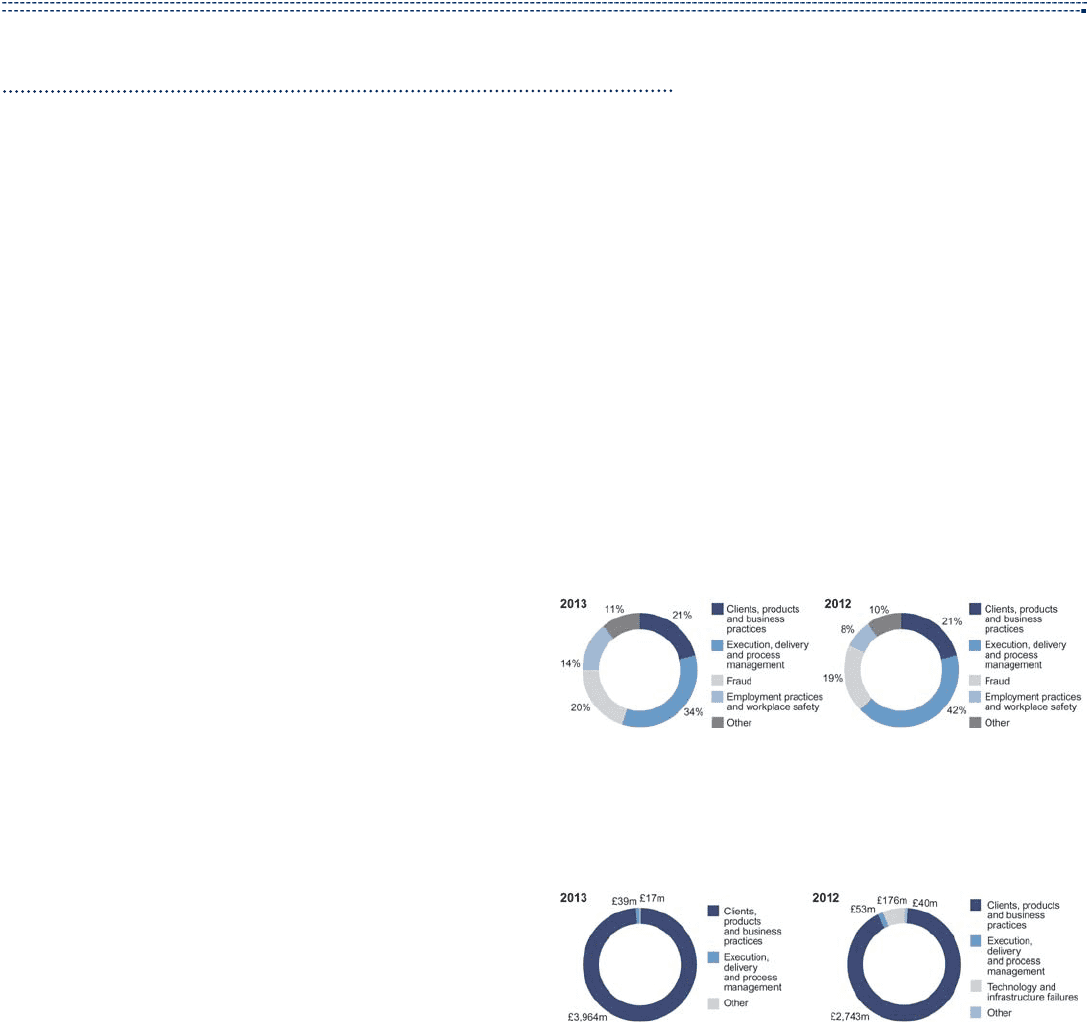
Number of events (net loss greater than £10,000)
At 31 December 2013, four categories accounted for around 90% of all
operational risk events. These were: (i) clients, products and business
practices; (ii) execution, delivery and process management; (iii) fraud;
and (iv) employment practices and workplace safety. This proportion was
broadly in line with 2012.
Value of events (net loss greater than £10,000)
At 31 December 2013, events aligned with clients, products and business
practices accounted for 99% of the losses (compared to 91% in 2012).
The losses in this category were as a result of new conduct-related
provisions, further increased provisions relating to Payment Protection
Insurance, Interest Rate Hedging Products, and regulatory settlements.
A small number of operational risk events contribute a high percentage of
the total losses. In 2013, less than 1% of the events contributed around
98% of the losses. This was in line with 2012.
Capital
The Group calculates the Pillar 1 capital requirement for operational risk
using the standardised approach (TSA). For 2013, the Group’s minimum
Pillar 1 capital requirement was £3.4 billion (2012 - £3.7 billion).