RBS 2013 Annual Report Download - page 303
Download and view the complete annual report
Please find page 303 of the 2013 RBS annual report below. You can navigate through the pages in the report by either clicking on the pages listed below, or by using the keyword search tool below to find specific information within the annual report.-
 1
1 -
2
-
3
-
4
-
5
-
6
-
7
-
8
-
9
-
10
-
11
-
12
-
13
-
14
-
15
-
16
-
17
-
18
-
19
-
20
-
21
-
22
-
23
-
24
-
25
-
26
-
27
-
28
-
29
-
30
-
31
-
32
-
33
-
34
-
35
-
36
-
37
-
38
-
39
-
40
-
41
-
42
-
43
-
44
-
45
-
46
-
47
-
48
-
49
-
50
-
51
-
52
-
53
-
54
-
55
-
56
-
57
-
58
-
59
-
60
-
61
-
62
-
63
-
64
-
65
-
66
-
67
-
68
-
69
-
70
-
71
-
72
-
73
-
74
-
75
-
76
-
77
-
78
-
79
-
80
-
81
-
82
-
83
-
84
-
85
-
86
-
87
-
88
-
89
-
90
-
91
-
92
-
93
-
94
-
95
-
96
-
97
-
98
-
99
-
100
-
101
-
102
-
103
-
104
-
105
-
106
-
107
-
108
-
109
-
110
-
111
-
112
-
113
-
114
-
115
-
116
-
117
-
118
-
119
-
120
-
121
-
122
-
123
-
124
-
125
-
126
-
127
-
128
-
129
-
130
-
131
-
132
-
133
-
134
-
135
-
136
-
137
-
138
-
139
-
140
-
141
-
142
-
143
-
144
-
145
-
146
-
147
-
148
-
149
-
150
-
151
-
152
-
153
-
154
-
155
-
156
-
157
-
158
-
159
-
160
-
161
-
162
-
163
-
164
-
165
-
166
-
167
-
168
-
169
-
170
-
171
-
172
-
173
-
174
-
175
-
176
-
177
-
178
-
179
-
180
-
181
-
182
-
183
-
184
-
185
-
186
-
187
-
188
-
189
-
190
-
191
-
192
-
193
-
194
-
195
-
196
-
197
-
198
-
199
-
200
-
201
-
202
-
203
-
204
-
205
-
206
-
207
-
208
-
209
-
210
-
211
-
212
-
213
-
214
-
215
-
216
-
217
-
218
-
219
-
220
-
221
-
222
-
223
-
224
-
225
-
226
-
227
-
228
-
229
-
230
-
231
-
232
-
233
-
234
-
235
-
236
-
237
-
238
-
239
-
240
-
241
-
242
-
243
-
244
-
245
-
246
-
247
-
248
-
249
-
250
-
251
-
252
-
253
-
254
-
255
-
256
-
257
-
258
-
259
-
260
-
261
-
262
-
263
-
264
-
265
-
266
-
267
-
268
-
269
-
270
-
271
-
272
-
273
-
274
-
275
-
276
-
277
-
278
-
279
-
280
-
281
-
282
-
283
-
284
-
285
-
286
-
287
-
288
-
289
-
290
-
291
-
292
-
 293
293 -
 294
294 -
 295
295 -
 296
296 -
 297
297 -
 298
298 -
 299
299 -
 300
300 -
 301
301 -
 302
302 -
 303
303 -
 304
304 -
 305
305 -
 306
306 -
 307
307 -
 308
308 -
 309
309 -
 310
310 -
 311
311 -
 312
312 -
 313
313 -
314
-
315
-
316
-
317
-
318
-
319
-
320
-
321
-
322
-
323
-
324
-
325
-
326
-
327
-
328
-
329
-
330
-
331
-
332
-
333
-
334
-
335
-
336
-
337
-
338
-
339
-
340
-
341
-
342
-
343
-
344
-
345
-
346
-
347
-
348
-
349
-
350
-
351
-
352
-
353
-
354
-
355
-
356
-
357
-
358
-
359
-
360
-
361
-
362
-
363
-
364
-
365
-
366
-
367
-
368
-
369
-
370
-
371
-
372
-
373
-
374
-
375
-
376
-
377
-
378
-
379
-
380
-
381
-
382
-
383
-
384
-
385
-
386
-
387
-
388
-
389
-
390
-
391
-
392
-
393
-
394
-
395
-
396
-
397
-
398
-
399
-
400
-
401
-
402
-
403
-
404
-
405
-
406
-
407
-
408
-
409
-
410
-
411
-
412
-
413
-
414
-
415
-
416
-
417
-
418
-
419
-
420
-
421
-
422
-
423
-
424
-
425
-
426
-
427
-
428
-
429
-
430
-
431
-
432
-
433
-
434
-
435
-
436
-
437
-
438
-
439
-
440
-
441
-
442
-
443
-
444
-
445
-
446
-
447
-
448
-
449
-
450
-
451
-
452
-
453
-
454
-
455
-
456
-
457
-
458
-
459
-
460
-
461
-
462
-
463
-
464
-
465
-
466
-
467
-
468
-
469
-
470
-
471
-
472
-
473
-
474
-
475
-
476
-
477
-
478
-
479
-
480
-
481
-
482
-
483
-
484
-
485
-
486
-
487
-
488
-
489
-
490
-
491
-
492
-
493
-
494
-
495
-
496
-
497
-
498
-
499
-
500
-
501
-
502
-
503
-
504
-
505
-
506
-
507
-
508
-
509
-
510
-
511
-
512
-
513
-
514
-
515
-
516
-
517
-
518
-
519
-
520
-
521
-
522
-
523
-
524
-
525
-
526
-
527
-
528
-
529
-
530
-
531
-
532
-
533
-
534
-
535
-
536
-
537
-
538
-
539
-
540
-
541
-
542
-
543
-
544
-
545
-
546
-
547
-
548
-
549
-
550
-
551
-
552
-
553
-
554
-
555
-
556
-
557
-
558
-
559
-
560
-
561
-
562
-
563
-
564
 |
 |

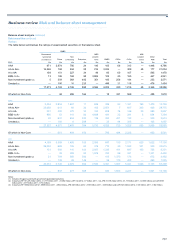
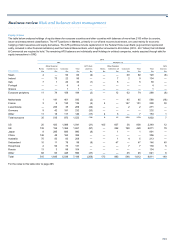
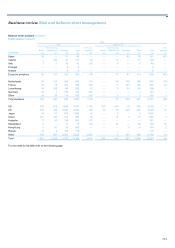
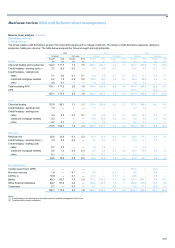
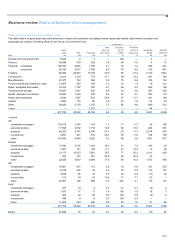
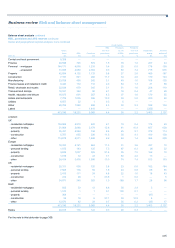
Business review Risk and balance sheet management
301
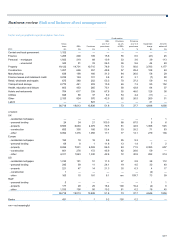
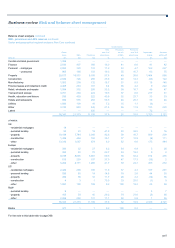
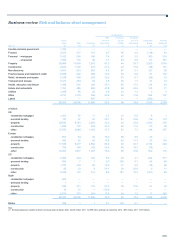
Sector and geographical regional analyses: Group
The tables below analyse gross loans and advances to banks and customers (excluding reverse repos) and related credit metrics by sector and
geography (by location of lending office) for the Group, Core and Non-Core.
Credit metrics
REIL Provisions Provisions
Gross as a % of as a % as a % of Impairment Amounts
loans REIL Provisions gross loans of REIL gross loans charge written-off
2013 £m £m £m %% % £m £m
Central and local government 8,643 22 —100 — 2 —
Finance 35,948 593 292 1.6 49 0.8 4 72
Personal - mortgages 148,533 6,025 1,799 4.1 30 1.2 392 441
- unsecured 28,160 2,417 1,909 8.6 79 6.8 415 861
Property 62,292 20,283 13,189 32.6 65 21.2 5,130 1,642
Construction 6,331 1,334 774 21.1 58 12.2 291 160
Manufacturing 21,377 742 559 3.5 75 2.6 195 104
Finance leases and instalment credit 13,587 263 190 1.9 72 1.4 16 121
Retail, wholesale and repairs 19,574 1,187 783 6.1 66 4.0 268 128
Transport and storage 16,697 1,491 635 8.9 43 3.8 487 229
Health, education and leisure 16,084 1,324 756 8.2 57 4.7 359 119
Hotels and restaurants 6,942 1,427 812 20.6 57 11.7 281 194
Utilities 4,960 131 80 2.6 61 1.6 54 23
Other 28,624 2,103 1,370 7.3 65 4.8 489 212
Latent — — 2,012 — — — 44 —
417,752 39,322 25,162 9.4 64 6.0 8,427 4,306
of which:
UK
- residential mortgages 110,515 1,900 319 1.7 17 0.3 39 180
- personal lending 17,098 2,052 1,718 12.0 84 10.0 264 681
- property 44,252 9,797 5,190 22.1 53 11.7 2,014 950
- construction 4,691 941 515 20.1 55 11.0 194 159
- other 110,466 4,684 3,202 4.2 68 2.9 1,091 537
Europe
- residential mortgages 17,540 3,155 1,303 18.0 41 7.4 195 26
- personal lending 1,267 141 129 11.1 91 10.2 19 26
- property 13,177 10,372 7,951 78.7 77 60.3 3,131 659
- construction 979 351 227 35.9 65 23.2 72 —
- other 22,620 4,057 3,498 17.9 86 15.5 1,012 465
US
- residential mortgages 19,901 951 173 4.8 18 0.9 161 233
- personal lending 8,722 207 45 2.4 22 0.5 114 151
- property 4,279 85 19 2.0 22 0.4 (11) 25
- construction 313 34 24 10.9 71 7.7 25 1
- other 27,887 198 589 0.7 297 2.1 65 131
RoW
- residential mortgages 577 19 4 3.3 21 0.7 (3) 2
- personal lending 1,073 17 17 1.6 100 1.6 18 3
- property 584 29 29 5.0 100 5.0 (4) 8
- construction 348 88 2.3 100 2.3 — —
- other 11,463 324 202 2.8 62 1.8 31 69
417,752 39,322 25,162 9.4 64 6.0 8,427 4,306
Banks 27,640 70 63 0.3 90 0.2 (15) 40