RBS 2013 Annual Report Download - page 495
Download and view the complete annual report
Please find page 495 of the 2013 RBS annual report below. You can navigate through the pages in the report by either clicking on the pages listed below, or by using the keyword search tool below to find specific information within the annual report.-
 1
1 -
2
-
3
-
4
-
5
-
6
-
7
-
8
-
9
-
10
-
11
-
12
-
13
-
14
-
15
-
16
-
17
-
18
-
19
-
20
-
21
-
22
-
23
-
24
-
25
-
26
-
27
-
28
-
29
-
30
-
31
-
32
-
33
-
34
-
35
-
36
-
37
-
38
-
39
-
40
-
41
-
42
-
43
-
44
-
45
-
46
-
47
-
48
-
49
-
50
-
51
-
52
-
53
-
54
-
55
-
56
-
57
-
58
-
59
-
60
-
61
-
62
-
63
-
64
-
65
-
66
-
67
-
68
-
69
-
70
-
71
-
72
-
73
-
74
-
75
-
76
-
77
-
78
-
79
-
80
-
81
-
82
-
83
-
84
-
85
-
86
-
87
-
88
-
89
-
90
-
91
-
92
-
93
-
94
-
95
-
96
-
97
-
98
-
99
-
100
-
101
-
102
-
103
-
104
-
105
-
106
-
107
-
108
-
109
-
110
-
111
-
112
-
113
-
114
-
115
-
116
-
117
-
118
-
119
-
120
-
121
-
122
-
123
-
124
-
125
-
126
-
127
-
128
-
129
-
130
-
131
-
132
-
133
-
134
-
135
-
136
-
137
-
138
-
139
-
140
-
141
-
142
-
143
-
144
-
145
-
146
-
147
-
148
-
149
-
150
-
151
-
152
-
153
-
154
-
155
-
156
-
157
-
158
-
159
-
160
-
161
-
162
-
163
-
164
-
165
-
166
-
167
-
168
-
169
-
170
-
171
-
172
-
173
-
174
-
175
-
176
-
177
-
178
-
179
-
180
-
181
-
182
-
183
-
184
-
185
-
186
-
187
-
188
-
189
-
190
-
191
-
192
-
193
-
194
-
195
-
196
-
197
-
198
-
199
-
200
-
201
-
202
-
203
-
204
-
205
-
206
-
207
-
208
-
209
-
210
-
211
-
212
-
213
-
214
-
215
-
216
-
217
-
218
-
219
-
220
-
221
-
222
-
223
-
224
-
225
-
226
-
227
-
228
-
229
-
230
-
231
-
232
-
233
-
234
-
235
-
236
-
237
-
238
-
239
-
240
-
241
-
242
-
243
-
244
-
245
-
246
-
247
-
248
-
249
-
250
-
251
-
252
-
253
-
254
-
255
-
256
-
257
-
258
-
259
-
260
-
261
-
262
-
263
-
264
-
265
-
266
-
267
-
268
-
269
-
270
-
271
-
272
-
273
-
274
-
275
-
276
-
277
-
278
-
279
-
280
-
281
-
282
-
283
-
284
-
285
-
286
-
287
-
288
-
289
-
290
-
291
-
292
-
293
-
294
-
295
-
296
-
297
-
298
-
299
-
300
-
301
-
302
-
303
-
304
-
305
-
306
-
307
-
308
-
309
-
310
-
311
-
312
-
313
-
314
-
315
-
316
-
317
-
318
-
319
-
320
-
321
-
322
-
323
-
324
-
325
-
326
-
327
-
328
-
329
-
330
-
331
-
332
-
333
-
334
-
335
-
336
-
337
-
338
-
339
-
340
-
341
-
342
-
343
-
344
-
345
-
346
-
347
-
348
-
349
-
350
-
351
-
352
-
353
-
354
-
355
-
356
-
357
-
358
-
359
-
360
-
361
-
362
-
363
-
364
-
365
-
366
-
367
-
368
-
369
-
370
-
371
-
372
-
373
-
374
-
375
-
376
-
377
-
378
-
379
-
380
-
381
-
382
-
383
-
384
-
385
-
386
-
387
-
388
-
389
-
390
-
391
-
392
-
393
-
394
-
395
-
396
-
397
-
398
-
399
-
400
-
401
-
402
-
403
-
404
-
405
-
406
-
407
-
408
-
409
-
410
-
411
-
412
-
413
-
414
-
415
-
416
-
417
-
418
-
419
-
420
-
421
-
422
-
423
-
424
-
425
-
426
-
427
-
428
-
429
-
430
-
431
-
432
-
433
-
434
-
435
-
436
-
437
-
438
-
439
-
440
-
441
-
442
-
443
-
444
-
445
-
446
-
447
-
448
-
449
-
450
-
451
-
452
-
453
-
454
-
455
-
456
-
457
-
458
-
459
-
460
-
461
-
462
-
463
-
464
-
465
-
466
-
467
-
468
-
469
-
470
-
471
-
472
-
473
-
474
-
475
-
476
-
477
-
478
-
479
-
480
-
481
-
482
-
483
-
484
-
 485
485 -
 486
486 -
 487
487 -
 488
488 -
 489
489 -
 490
490 -
 491
491 -
 492
492 -
 493
493 -
 494
494 -
 495
495 -
 496
496 -
 497
497 -
 498
498 -
 499
499 -
 500
500 -
 501
501 -
 502
502 -
 503
503 -
 504
504 -
 505
505 -
506
-
507
-
508
-
509
-
510
-
511
-
512
-
513
-
514
-
515
-
516
-
517
-
518
-
519
-
520
-
521
-
522
-
523
-
524
-
525
-
526
-
527
-
528
-
529
-
530
-
531
-
532
-
533
-
534
-
535
-
536
-
537
-
538
-
539
-
540
-
541
-
542
-
543
-
544
-
545
-
546
-
547
-
548
-
549
-
550
-
551
-
552
-
553
-
554
-
555
-
556
-
557
-
558
-
559
-
560
-
561
-
562
-
563
-
564
 |
 |

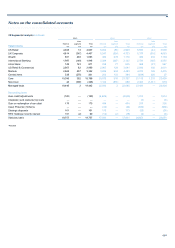
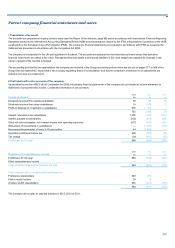
Notes on the consolidated accounts
493
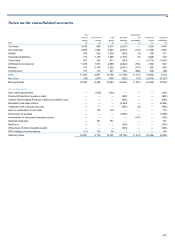
(b) Geographical segments
The geographical analysis in the tables below has been compiled on the basis of location of office where the transactions are recorded.
UK USA Europe RoW Total
2013 £m £m £m £m £m
Total revenue 16,015 5,515 2,913 2,015 26,458
Net interest income 7,794 2,200 746 241 10,981
Net fees and commissions 2,544 1,099 663 212 4,518
Income from trading activities 1,474 1,013 106 92 2,685
Other operating income 644 382 242 305 1,573
Total income 12,456 4,694 1,757 850 19,757
Operating (loss)/profit before tax (2,444) (615) (5,262) 78 (8,243)
Total assets 747,347 197,789 40,113 42,629 1,027,878
Of which total assets held for sale 915 750 198 1,154 3,017
Total liabilities 692,861 183,549 50,107 42,146 968,663
Of which total liabilities held for sale — 3,210 81 87 3,378
Net assets attributable to equity owners and non-controlling interests 54,486 14,240 (9,994) 483 59,215
Contingent liabilities and commitments 107,500 83,048 41,368 10,093 242,009
Cost to acquire property, plant and equipment and intangible assets 1,086 428 232 10 1,756
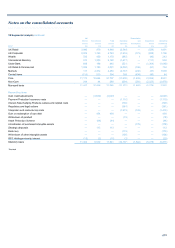
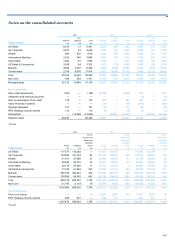
2012*
Total revenue 12,396 6,824 3,790 2,893 25,903
Net interest income 8,212 2,157 770 263 11,402
Net fees and commissions 2,834 1,220 564 257 4,875
Income from trading activities (314) 1,539 193 257 1,675
Other operating (loss)/income (710) 282 356 61 (11)
Total income 10,022 5,198 1,883 838 17,941
Operating (loss)/profit before tax (4,671) 1,821 (2,034) (393) (5,277)
Total assets 899,604 305,588 47,966 59,137 1,312,295
Of which total assets held for sale 11,638 291 1,001 1,083 14,013
Total liabilities 835,268 288,005 61,801 56,773 1,241,847
Of which total liabilities held for sale 8,405 129 871 765 10,170
Net assets attributable to equity owners and non-controlling interests 64,336 17,583 (13,835) 2,364 70,448
Contingent liabilities and commitments 105,018 84,788 49,341 8,498 247,645
Cost to acquire property, plant and equipment and intangible assets 1,953 325 186 69 2,533
2011*
Total revenue 18,212 7,271 5,067 3,796 34,346
Net interest income 8,367 2,430 962 544 12,303
Net fees and commissions 3,389 1,365 244 419 5,417
Income from trading activities 661 1,318 508 214 2,701
Other operating income/(loss) 2,950 219 1,079 (18) 4,230
Total income 15,367 5,332 2,793 1,159 24,651
Operating profit/(loss) before tax 667 1,794 (3,419) (438) (1,396)
Total assets 1,007,096 359,592 66,239 73,940 1,506,867
Of which total assets held for sale 19,343 53 6,011 43 25,450
Total liabilities 936,477 341,631 82,059 70,647 1,430,814
Of which total liabilities held for sale 21,903 104 1,988 — 23,995
Net assets attributable to equity owners and non-controlling interests 70,619 17,961 (15,820) 3,293 76,053
Contingent liabilities and commitments 118,702 95,703 51,465 12,949 278,819
Cost to acquire property, plant and equipment and intangible assets 2,522 500 1,484 58 4,564
*Restated