RBS 2013 Annual Report Download - page 271
Download and view the complete annual report
Please find page 271 of the 2013 RBS annual report below. You can navigate through the pages in the report by either clicking on the pages listed below, or by using the keyword search tool below to find specific information within the annual report.-
 1
1 -
2
-
3
-
4
-
5
-
6
-
7
-
8
-
9
-
10
-
11
-
12
-
13
-
14
-
15
-
16
-
17
-
18
-
19
-
20
-
21
-
22
-
23
-
24
-
25
-
26
-
27
-
28
-
29
-
30
-
31
-
32
-
33
-
34
-
35
-
36
-
37
-
38
-
39
-
40
-
41
-
42
-
43
-
44
-
45
-
46
-
47
-
48
-
49
-
50
-
51
-
52
-
53
-
54
-
55
-
56
-
57
-
58
-
59
-
60
-
61
-
62
-
63
-
64
-
65
-
66
-
67
-
68
-
69
-
70
-
71
-
72
-
73
-
74
-
75
-
76
-
77
-
78
-
79
-
80
-
81
-
82
-
83
-
84
-
85
-
86
-
87
-
88
-
89
-
90
-
91
-
92
-
93
-
94
-
95
-
96
-
97
-
98
-
99
-
100
-
101
-
102
-
103
-
104
-
105
-
106
-
107
-
108
-
109
-
110
-
111
-
112
-
113
-
114
-
115
-
116
-
117
-
118
-
119
-
120
-
121
-
122
-
123
-
124
-
125
-
126
-
127
-
128
-
129
-
130
-
131
-
132
-
133
-
134
-
135
-
136
-
137
-
138
-
139
-
140
-
141
-
142
-
143
-
144
-
145
-
146
-
147
-
148
-
149
-
150
-
151
-
152
-
153
-
154
-
155
-
156
-
157
-
158
-
159
-
160
-
161
-
162
-
163
-
164
-
165
-
166
-
167
-
168
-
169
-
170
-
171
-
172
-
173
-
174
-
175
-
176
-
177
-
178
-
179
-
180
-
181
-
182
-
183
-
184
-
185
-
186
-
187
-
188
-
189
-
190
-
191
-
192
-
193
-
194
-
195
-
196
-
197
-
198
-
199
-
200
-
201
-
202
-
203
-
204
-
205
-
206
-
207
-
208
-
209
-
210
-
211
-
212
-
213
-
214
-
215
-
216
-
217
-
218
-
219
-
220
-
221
-
222
-
223
-
224
-
225
-
226
-
227
-
228
-
229
-
230
-
231
-
232
-
233
-
234
-
235
-
236
-
237
-
238
-
239
-
240
-
241
-
242
-
243
-
244
-
245
-
246
-
247
-
248
-
249
-
250
-
251
-
252
-
253
-
254
-
255
-
256
-
257
-
258
-
259
-
260
-
 261
261 -
 262
262 -
 263
263 -
 264
264 -
 265
265 -
 266
266 -
 267
267 -
 268
268 -
 269
269 -
 270
270 -
 271
271 -
 272
272 -
 273
273 -
 274
274 -
 275
275 -
 276
276 -
 277
277 -
 278
278 -
 279
279 -
 280
280 -
 281
281 -
282
-
283
-
284
-
285
-
286
-
287
-
288
-
289
-
290
-
291
-
292
-
293
-
294
-
295
-
296
-
297
-
298
-
299
-
300
-
301
-
302
-
303
-
304
-
305
-
306
-
307
-
308
-
309
-
310
-
311
-
312
-
313
-
314
-
315
-
316
-
317
-
318
-
319
-
320
-
321
-
322
-
323
-
324
-
325
-
326
-
327
-
328
-
329
-
330
-
331
-
332
-
333
-
334
-
335
-
336
-
337
-
338
-
339
-
340
-
341
-
342
-
343
-
344
-
345
-
346
-
347
-
348
-
349
-
350
-
351
-
352
-
353
-
354
-
355
-
356
-
357
-
358
-
359
-
360
-
361
-
362
-
363
-
364
-
365
-
366
-
367
-
368
-
369
-
370
-
371
-
372
-
373
-
374
-
375
-
376
-
377
-
378
-
379
-
380
-
381
-
382
-
383
-
384
-
385
-
386
-
387
-
388
-
389
-
390
-
391
-
392
-
393
-
394
-
395
-
396
-
397
-
398
-
399
-
400
-
401
-
402
-
403
-
404
-
405
-
406
-
407
-
408
-
409
-
410
-
411
-
412
-
413
-
414
-
415
-
416
-
417
-
418
-
419
-
420
-
421
-
422
-
423
-
424
-
425
-
426
-
427
-
428
-
429
-
430
-
431
-
432
-
433
-
434
-
435
-
436
-
437
-
438
-
439
-
440
-
441
-
442
-
443
-
444
-
445
-
446
-
447
-
448
-
449
-
450
-
451
-
452
-
453
-
454
-
455
-
456
-
457
-
458
-
459
-
460
-
461
-
462
-
463
-
464
-
465
-
466
-
467
-
468
-
469
-
470
-
471
-
472
-
473
-
474
-
475
-
476
-
477
-
478
-
479
-
480
-
481
-
482
-
483
-
484
-
485
-
486
-
487
-
488
-
489
-
490
-
491
-
492
-
493
-
494
-
495
-
496
-
497
-
498
-
499
-
500
-
501
-
502
-
503
-
504
-
505
-
506
-
507
-
508
-
509
-
510
-
511
-
512
-
513
-
514
-
515
-
516
-
517
-
518
-
519
-
520
-
521
-
522
-
523
-
524
-
525
-
526
-
527
-
528
-
529
-
530
-
531
-
532
-
533
-
534
-
535
-
536
-
537
-
538
-
539
-
540
-
541
-
542
-
543
-
544
-
545
-
546
-
547
-
548
-
549
-
550
-
551
-
552
-
553
-
554
-
555
-
556
-
557
-
558
-
559
-
560
-
561
-
562
-
563
-
564
 |
 |

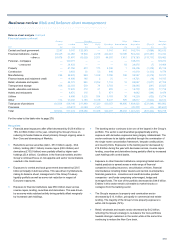
Business review Risk and balance sheet management
269
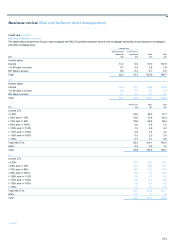
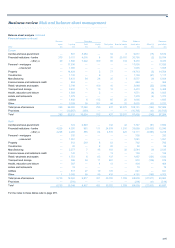
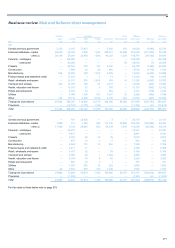
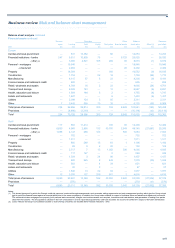
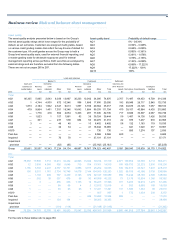
Balance sheet analysis
Credit risk assets analysed on pages 231 to 237 are reported internally to senior management. However, they exclude certain exposures, primarily
securities and reverse repurchase agreements and take account of legal netting agreements, that provide a right of legal set-off but do not meet the
criteria for offset in IFRS. The tables that follow are therefore provided to supplement the credit risk assets analysis and other analysis to reconcile to the
balance sheet. All the disclosures in this section are audited except those relating to RCR on pages 299 and 300.
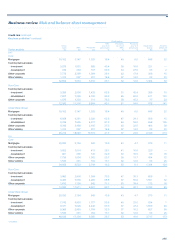
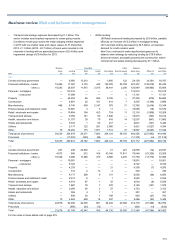
Financial assets
Exposure summary
The table below analyses the Group’s financial assets exposures, both gross and net of offset arrangements as well as credit mitigation and
enhancement.
Collateral Exposure
post credit
Gross IFRS Carrying Balance sheet Real estate and other Credit mitigation and
exposure offset (1) value (2) offset (3) Cash (4) Securities (5) residential (6) commercial (6) Enhancement (7) enhancement
2013 £bn £bn £bn £bn £bn £bn £bn £bn £bn £bn
Cash and balances at central banks 82.7 — 82.7 — — — — — — 82.7
Reverse repos 117.2 (40.7) 76.5 (11.4) — (65.0) — — — 0.1
Lending 423.6 (3.4) 420.2 (32.3) (1.6) (2.7) (145.4) (60.0) (3.9) 174.3
Debt securities 113.6 — 113.6 — — — — — (1.3) 112.3
Equity shares 8.8 — 8.8 — — — — — — 8.8
Derivatives 553.7 (265.7) 288.0 (242.8) (24.3) (6.0) — — (7.3) 7.6
Settlement balances 8.2 (2.7) 5.5 (0.3) — — — — — 5.2
Total 1,307.8 (312.5) 995.3 (286.8) (25.9) (73.7) (145.4) (60.0) (12.5) 391.0
Short positions (28.0) — (28.0) — — — — — — (28.0)
Net of short positions 1,279.8 (312.5) 967.3 (286.8) (25.9) (73.7) (145.4) (60.0) (12.5) 363.0
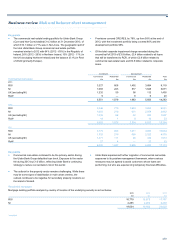
Notes:
(1) Relates to offset arrangements that comply with IFRS criteria and transactions cleared through and novated to central clearing houses, primarily London Clearing House and US Government
Securities Clearing Corporation.
(2) Carrying value on the balance sheet represents the exposure to credit risk by class of financial instrument.
(3) Balance sheet offset reflects the amounts by which the Group’s credit risk is reduced through master netting and cash management pooling arrangements. Derivative master netting agreements
include cash pledged with counterparties in respect of net derivative liability positions and are included in lending in the table above.
(4) Includes cash collateral pledged by counterparties based on daily mark-to-market movements of net derivative positions with the counterparty.
(5) Securities collateral represent the fair value of securities received from counterparties, mainly relating to reverse repo transactions as part of netting arrangements.
(6) Property valuations are limited to the loan value and reflect the application of haircuts and capping in line with regulatory rules to indexed valuations. Commercial collateral includes shipping vessels
and plant and equipment collateral.
(7) Credit enhancement comprises credit derivatives (bought protection) and guarantees and reflect notional amounts less fair value and notional amounts respectively.