RBS 2013 Annual Report Download - page 129
Download and view the complete annual report
Please find page 129 of the 2013 RBS annual report below. You can navigate through the pages in the report by either clicking on the pages listed below, or by using the keyword search tool below to find specific information within the annual report.-
 1
1 -
2
-
3
-
4
-
5
-
6
-
7
-
8
-
9
-
10
-
11
-
12
-
13
-
14
-
15
-
16
-
17
-
18
-
19
-
20
-
21
-
22
-
23
-
24
-
25
-
26
-
27
-
28
-
29
-
30
-
31
-
32
-
33
-
34
-
35
-
36
-
37
-
38
-
39
-
40
-
41
-
42
-
43
-
44
-
45
-
46
-
47
-
48
-
49
-
50
-
51
-
52
-
53
-
54
-
55
-
56
-
57
-
58
-
59
-
60
-
61
-
62
-
63
-
64
-
65
-
66
-
67
-
68
-
69
-
70
-
71
-
72
-
73
-
74
-
75
-
76
-
77
-
78
-
79
-
80
-
81
-
82
-
83
-
84
-
85
-
86
-
87
-
88
-
89
-
90
-
91
-
92
-
93
-
94
-
95
-
96
-
97
-
98
-
99
-
100
-
101
-
102
-
103
-
104
-
105
-
106
-
107
-
108
-
109
-
110
-
111
-
112
-
113
-
114
-
115
-
116
-
117
-
118
-
 119
119 -
 120
120 -
 121
121 -
 122
122 -
 123
123 -
 124
124 -
 125
125 -
 126
126 -
 127
127 -
 128
128 -
 129
129 -
 130
130 -
 131
131 -
 132
132 -
 133
133 -
 134
134 -
 135
135 -
 136
136 -
 137
137 -
 138
138 -
 139
139 -
140
-
141
-
142
-
143
-
144
-
145
-
146
-
147
-
148
-
149
-
150
-
151
-
152
-
153
-
154
-
155
-
156
-
157
-
158
-
159
-
160
-
161
-
162
-
163
-
164
-
165
-
166
-
167
-
168
-
169
-
170
-
171
-
172
-
173
-
174
-
175
-
176
-
177
-
178
-
179
-
180
-
181
-
182
-
183
-
184
-
185
-
186
-
187
-
188
-
189
-
190
-
191
-
192
-
193
-
194
-
195
-
196
-
197
-
198
-
199
-
200
-
201
-
202
-
203
-
204
-
205
-
206
-
207
-
208
-
209
-
210
-
211
-
212
-
213
-
214
-
215
-
216
-
217
-
218
-
219
-
220
-
221
-
222
-
223
-
224
-
225
-
226
-
227
-
228
-
229
-
230
-
231
-
232
-
233
-
234
-
235
-
236
-
237
-
238
-
239
-
240
-
241
-
242
-
243
-
244
-
245
-
246
-
247
-
248
-
249
-
250
-
251
-
252
-
253
-
254
-
255
-
256
-
257
-
258
-
259
-
260
-
261
-
262
-
263
-
264
-
265
-
266
-
267
-
268
-
269
-
270
-
271
-
272
-
273
-
274
-
275
-
276
-
277
-
278
-
279
-
280
-
281
-
282
-
283
-
284
-
285
-
286
-
287
-
288
-
289
-
290
-
291
-
292
-
293
-
294
-
295
-
296
-
297
-
298
-
299
-
300
-
301
-
302
-
303
-
304
-
305
-
306
-
307
-
308
-
309
-
310
-
311
-
312
-
313
-
314
-
315
-
316
-
317
-
318
-
319
-
320
-
321
-
322
-
323
-
324
-
325
-
326
-
327
-
328
-
329
-
330
-
331
-
332
-
333
-
334
-
335
-
336
-
337
-
338
-
339
-
340
-
341
-
342
-
343
-
344
-
345
-
346
-
347
-
348
-
349
-
350
-
351
-
352
-
353
-
354
-
355
-
356
-
357
-
358
-
359
-
360
-
361
-
362
-
363
-
364
-
365
-
366
-
367
-
368
-
369
-
370
-
371
-
372
-
373
-
374
-
375
-
376
-
377
-
378
-
379
-
380
-
381
-
382
-
383
-
384
-
385
-
386
-
387
-
388
-
389
-
390
-
391
-
392
-
393
-
394
-
395
-
396
-
397
-
398
-
399
-
400
-
401
-
402
-
403
-
404
-
405
-
406
-
407
-
408
-
409
-
410
-
411
-
412
-
413
-
414
-
415
-
416
-
417
-
418
-
419
-
420
-
421
-
422
-
423
-
424
-
425
-
426
-
427
-
428
-
429
-
430
-
431
-
432
-
433
-
434
-
435
-
436
-
437
-
438
-
439
-
440
-
441
-
442
-
443
-
444
-
445
-
446
-
447
-
448
-
449
-
450
-
451
-
452
-
453
-
454
-
455
-
456
-
457
-
458
-
459
-
460
-
461
-
462
-
463
-
464
-
465
-
466
-
467
-
468
-
469
-
470
-
471
-
472
-
473
-
474
-
475
-
476
-
477
-
478
-
479
-
480
-
481
-
482
-
483
-
484
-
485
-
486
-
487
-
488
-
489
-
490
-
491
-
492
-
493
-
494
-
495
-
496
-
497
-
498
-
499
-
500
-
501
-
502
-
503
-
504
-
505
-
506
-
507
-
508
-
509
-
510
-
511
-
512
-
513
-
514
-
515
-
516
-
517
-
518
-
519
-
520
-
521
-
522
-
523
-
524
-
525
-
526
-
527
-
528
-
529
-
530
-
531
-
532
-
533
-
534
-
535
-
536
-
537
-
538
-
539
-
540
-
541
-
542
-
543
-
544
-
545
-
546
-
547
-
548
-
549
-
550
-
551
-
552
-
553
-
554
-
555
-
556
-
557
-
558
-
559
-
560
-
561
-
562
-
563
-
564
 |
 |

Business review
127
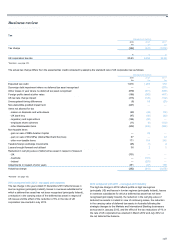
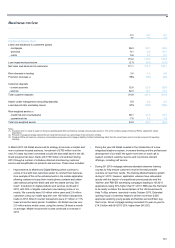
Impairment losses
Managed (1) Statutory
2013 2012 2011 2013 2012 2011
£m £m £m £m £m £m
New impairment losses 8,688 5,620 7,964 8,688 5,620 9,234
Less: recoveries of amounts previously written-off (256) (341) (527) (256) (341) (527)
Charge to income statement 8,432 5,279 7,437 8,432 5,279 8,707
Comprising:
Loan impairment losses 8,412 5,315 7,241 8,412 5,315 7,241
Securities
- sovereign debt impairment and related interest rate hedge
adjustments — — — — — 1,268
- other 20 (36) 196 20 (36) 198
Charge to income statement 8,432 5,279 7,437 8,432 5,279 8,707
Of which RCR related (2) 4,490 — — 4,490 — —
Notes:
(1) Managed basis excludes sovereign debt impairment and related interest rate hedge adjustments.
(2) Pertaining to the creation of RCR and related strategy.
RBS Capital Resolution ('RCR') was set up from 1 January 2014 and will
manage a pool of £29 billion of assets with particularly high capital
intensity or potentially volatile outcomes in stressed environments, aiming
to accelerate the run-down of these exposures over a three year period to
free up capital for the bank. This revised strategy to run down high risk
loans faster resulted in an increased impairment charge relating to
impaired or non-performing assets transferred to RCR, reflecting adverse
changes in our estimates of future cash flows. Further details about RCR
are set out on pages 160 to 163.
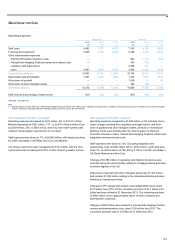
2013 compared with 2012 - managed and statutory
Group loan impairment losses rose by 58% to £8,412 million reflecting
the increased provisions recognised in connection with the creation of
RCR. Adjusting for this, impairment losses fell by £1,393 million (26%) to
£3,922 million, driven by significant improvements in Non-Core, Ulster
Bank and UK Retail, partially offset by increases in International Banking,
US Retail & Commercial and Markets.
Additional loan impairments arising from the RCR accelerated asset
recovery strategy totalled £4,490 million, of which £3,118 million related
to Non-Core, £892 million to Ulster Bank, £410 million to UK Corporate,
£52 million to International Banking and £18 million to Markets.
Excluding the impact of the creation of RCR, Core Ulster Bank loan
impairments fell by £482 million (35%) to £882 million, mainly as a result
of continued improvement in retail mortgage debt-flow and in recovery
trends. UK Retail loan impairments fell by £210 million (40%), primarily
from lower default levels.
Excluding the impact of the creation of RCR, Non-Core loan impairments
fell by £792 million to £1,528 million, reflecting the continued reduction in
the overall portfolio.
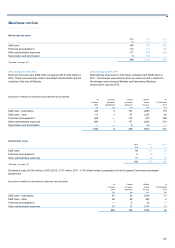
2012 compared with 2011 - managed and statutory
Loan impairment losses declined by £1,926 million to £5,315 million,
primarily driven by a £1,518 million fall in Non-Core impairments, mostly
in the Ulster Bank and commercial real estate portfolios.
Core loan impairments were down £408 million, or 12%, largely due to
lower default rates in UK Retail and an improved credit environment for
US Retail & Commercial, which helped drive impairment reductions of
£259 million and £165 million respectively. Core Ulster Bank impairments
stabilised, though still at a very high level (£1,364 million in 2012 versus
£1,384 million in 2011).
Loan impairments as a percentage of gross loans and advances
improved by 30 basis points, principally reflecting the improved credit
profile in Non-Core and the better US credit environment.
Loan impairment provisions rose to £21.3 billion, increasing coverage of
risk elements in lending to 52%, compared with 49% in 2011.