RBS 2013 Annual Report Download - page 167
Download and view the complete annual report
Please find page 167 of the 2013 RBS annual report below. You can navigate through the pages in the report by either clicking on the pages listed below, or by using the keyword search tool below to find specific information within the annual report.-
 1
1 -
2
-
3
-
4
-
5
-
6
-
7
-
8
-
9
-
10
-
11
-
12
-
13
-
14
-
15
-
16
-
17
-
18
-
19
-
20
-
21
-
22
-
23
-
24
-
25
-
26
-
27
-
28
-
29
-
30
-
31
-
32
-
33
-
34
-
35
-
36
-
37
-
38
-
39
-
40
-
41
-
42
-
43
-
44
-
45
-
46
-
47
-
48
-
49
-
50
-
51
-
52
-
53
-
54
-
55
-
56
-
57
-
58
-
59
-
60
-
61
-
62
-
63
-
64
-
65
-
66
-
67
-
68
-
69
-
70
-
71
-
72
-
73
-
74
-
75
-
76
-
77
-
78
-
79
-
80
-
81
-
82
-
83
-
84
-
85
-
86
-
87
-
88
-
89
-
90
-
91
-
92
-
93
-
94
-
95
-
96
-
97
-
98
-
99
-
100
-
101
-
102
-
103
-
104
-
105
-
106
-
107
-
108
-
109
-
110
-
111
-
112
-
113
-
114
-
115
-
116
-
117
-
118
-
119
-
120
-
121
-
122
-
123
-
124
-
125
-
126
-
127
-
128
-
129
-
130
-
131
-
132
-
133
-
134
-
135
-
136
-
137
-
138
-
139
-
140
-
141
-
142
-
143
-
144
-
145
-
146
-
147
-
148
-
149
-
150
-
151
-
152
-
153
-
154
-
155
-
156
-
 157
157 -
 158
158 -
 159
159 -
 160
160 -
 161
161 -
 162
162 -
 163
163 -
 164
164 -
 165
165 -
 166
166 -
 167
167 -
 168
168 -
 169
169 -
 170
170 -
 171
171 -
 172
172 -
 173
173 -
 174
174 -
 175
175 -
 176
176 -
 177
177 -
178
-
179
-
180
-
181
-
182
-
183
-
184
-
185
-
186
-
187
-
188
-
189
-
190
-
191
-
192
-
193
-
194
-
195
-
196
-
197
-
198
-
199
-
200
-
201
-
202
-
203
-
204
-
205
-
206
-
207
-
208
-
209
-
210
-
211
-
212
-
213
-
214
-
215
-
216
-
217
-
218
-
219
-
220
-
221
-
222
-
223
-
224
-
225
-
226
-
227
-
228
-
229
-
230
-
231
-
232
-
233
-
234
-
235
-
236
-
237
-
238
-
239
-
240
-
241
-
242
-
243
-
244
-
245
-
246
-
247
-
248
-
249
-
250
-
251
-
252
-
253
-
254
-
255
-
256
-
257
-
258
-
259
-
260
-
261
-
262
-
263
-
264
-
265
-
266
-
267
-
268
-
269
-
270
-
271
-
272
-
273
-
274
-
275
-
276
-
277
-
278
-
279
-
280
-
281
-
282
-
283
-
284
-
285
-
286
-
287
-
288
-
289
-
290
-
291
-
292
-
293
-
294
-
295
-
296
-
297
-
298
-
299
-
300
-
301
-
302
-
303
-
304
-
305
-
306
-
307
-
308
-
309
-
310
-
311
-
312
-
313
-
314
-
315
-
316
-
317
-
318
-
319
-
320
-
321
-
322
-
323
-
324
-
325
-
326
-
327
-
328
-
329
-
330
-
331
-
332
-
333
-
334
-
335
-
336
-
337
-
338
-
339
-
340
-
341
-
342
-
343
-
344
-
345
-
346
-
347
-
348
-
349
-
350
-
351
-
352
-
353
-
354
-
355
-
356
-
357
-
358
-
359
-
360
-
361
-
362
-
363
-
364
-
365
-
366
-
367
-
368
-
369
-
370
-
371
-
372
-
373
-
374
-
375
-
376
-
377
-
378
-
379
-
380
-
381
-
382
-
383
-
384
-
385
-
386
-
387
-
388
-
389
-
390
-
391
-
392
-
393
-
394
-
395
-
396
-
397
-
398
-
399
-
400
-
401
-
402
-
403
-
404
-
405
-
406
-
407
-
408
-
409
-
410
-
411
-
412
-
413
-
414
-
415
-
416
-
417
-
418
-
419
-
420
-
421
-
422
-
423
-
424
-
425
-
426
-
427
-
428
-
429
-
430
-
431
-
432
-
433
-
434
-
435
-
436
-
437
-
438
-
439
-
440
-
441
-
442
-
443
-
444
-
445
-
446
-
447
-
448
-
449
-
450
-
451
-
452
-
453
-
454
-
455
-
456
-
457
-
458
-
459
-
460
-
461
-
462
-
463
-
464
-
465
-
466
-
467
-
468
-
469
-
470
-
471
-
472
-
473
-
474
-
475
-
476
-
477
-
478
-
479
-
480
-
481
-
482
-
483
-
484
-
485
-
486
-
487
-
488
-
489
-
490
-
491
-
492
-
493
-
494
-
495
-
496
-
497
-
498
-
499
-
500
-
501
-
502
-
503
-
504
-
505
-
506
-
507
-
508
-
509
-
510
-
511
-
512
-
513
-
514
-
515
-
516
-
517
-
518
-
519
-
520
-
521
-
522
-
523
-
524
-
525
-
526
-
527
-
528
-
529
-
530
-
531
-
532
-
533
-
534
-
535
-
536
-
537
-
538
-
539
-
540
-
541
-
542
-
543
-
544
-
545
-
546
-
547
-
548
-
549
-
550
-
551
-
552
-
553
-
554
-
555
-
556
-
557
-
558
-
559
-
560
-
561
-
562
-
563
-
564
 |
 |

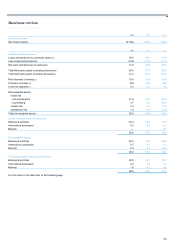
Business review
165
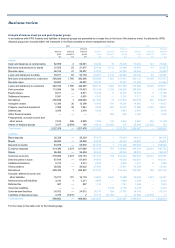
Commentary on consolidated balance sheet
2013 compared with 2012
Total assets of £1,027.9 billion at 31 December 2013 were down £284.4
billion, 22%, compared with 31 December 2012. This was driven by the
downsizing of the Markets business, primarily reflected in decreases in
loans to banks and customers, debt securities and derivatives balances,
and a further decrease in loans and advances to banks and customers
due to Non-Core disposals and run off.
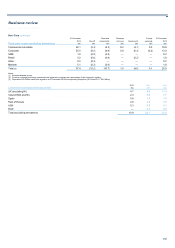
Loans and advances to banks decreased by £9.9 billion, 15%, to £54.1
billion. Excluding reverse repurchase agreements and stock borrowing
(‘reverse repos’), down £8.3 billion, 24%, to £26.5 billion, bank placings
declined £1.6 billion, 6%, to £27.6 billion.
Loans and advances to customers declined £59.4 billion, 12%, to £440.7
billion. Within this, reverse repurchase agreements were down £20.1
billion, 29%, to £49.9 billion. Customer lending decreased by £39.3
billion, 9%, to £390.8 billion, or £35.2 billion to £416.0 billion before
impairments. This reflected reductions in Non-Core of £19.9 billion, along
with declines in International Banking, £6.2 billion, UK Corporate, £4.5
billion, Markets, £4.3 billion, Ulster Bank, £1.9 billion, UK Retail, £0.4
billion, Wealth, £0.3 billion, and US Retail & Commercial, £0.2 billion
which included the impact of £0.7 billion of customer loans being
transferred to assets of disposal groups at 31 December 2013. These
decreases were partially offset by the effect of exchange rate and other
movements, £2.5 billion.
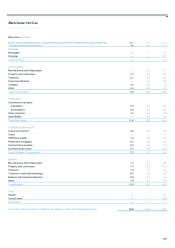
Debt securities were down £43.8 billion, 28%, to £113.6 billion, driven
mainly by reductions within Markets and Group Treasury in holdings of
UK and Eurozone government securities and financial institution bonds.
Equity shares decreased by £6.4 billion, 42%, to £8.8 billion due to the
targeted run-down of Markets’ equities business.
Movements in the value of derivative assets, down £153.9 billion, 35%, to
£288.0 billion, and liabilities, down £148.8 billion, 34% to £285.5 billion,
primarily reflects upward shifts in major yield curves which resulted in
significant mark-to-market decreases on interest rate contracts.
Property, plant and equipment decreased by £1.9 billion, 19%, to £7.9
billion driven largely by the disposal of Non-Core assets.
Intangible assets decreased by £1.2 billion, 9%, to £12.4 billion primarily
as a result of the write-down of goodwill relating to the International
Banking division at 31 December 2013.
The decrease in assets and liabilities of disposal groups, down £11.0
billion, 78%, to £3.0 billion, and £6.8 billion, 67%, to £3.4 billion
respectively, primarily reflects the deconsolidation of Direct Line Group
following the further sale of shares and ceding of control in 2013. The
remaining interest, classified as an associate, is included in assets of
disposal groups at 31 December 2013. In addition, disposal groups
include loans and deposits in Illinois branches for sale in US Retail &
Commercial.
Deposits by banks decreased £37.4 billion, 37%, to £64.0 billion, with
decreases in inter-bank deposits, down £21.7 billion, 38%, to £35.3 billion
and repurchase agreements and stock lending (‘repos’), down £15.7
billion, 35%, to £28.7 billion, as a result of the Group’s lower funding
requirements and reduced derivative cash collateral.
Customer accounts decreased £50.4 billion, 10%, to £470.9 billion.
Within this, repos decreased £31.6 billion, 36%, to £56.5 billion.
Excluding repos, customer deposits were down £18.8 billion, 4%, at
£414.4 billion, primarily reflecting decreases in International Banking,
£6.9 billion, Markets, £4.8 billion, UK Corporate, £2.4 billion, Wealth, £1.7
billion, Ulster Bank, £0.7 billion, US Retail & Commercial, £5.9 billion,
which included the impact of £3.2 billion of customer deposits being
transferred to liabilities of disposal groups at 31 December 2013, and the
effect of exchange rate and other movements of £3.4 billion. These
decreases were partially offset by increases in UK Retail, £7.3 billion.
Debt securities in issue decreased £26.8 billion, 28%, to £67.8 billion due
to lower funding requirements as a result of the reduction in the overall
size of the balance sheet, with most of the reduction in medium term
notes in issue.
Retirement benefit liabilities decreased by £0.7 billion, 17%, to £3.2 billion
with net actuarial gains of £0.5 billion arising from improved asset returns
and higher discount rates partly offset by an increase in the assumed
inflation rate. Additional employer contributions of £0.4 billion to the
Group’s Main scheme also reduced retirement benefit liabilities.
Subordinated liabilities decreased by £2.8 billion, 10% to £24.0 billion,
primarily as a result of the net decrease in dated loan capital with
redemptions of £3.4 billion and the effects of exchange and other
movements of £1.2 billion being partially offset by issuances of £1.8
billion.
Minority interests decreased by £1.3 billion, 73%, to £0.5 billion,
predominantly due to the deconsolidation of Direct Line Group following
the further sale of shares and ceding of control in 2013.
Owner’s equity decreased by £9.9 billion, 14%, to £58.7 billion, driven by
the £9.0 billion attributable loss for the year together with movements in
cash flow hedging reserves, £1.7 billion and foreign exchange reserves,
£0.2 billion. Partially offsetting these reductions were share issuances of
£0.4 billion, the termination of the contingent capital facility, £0.3 billion,
the recognition of actuarial gains in respect of the Group’s defined benefit
pension schemes, net of tax, £0.2 billion and other reserve movements,
£0.1 billion.