RBS 2013 Annual Report Download - page 309
Download and view the complete annual report
Please find page 309 of the 2013 RBS annual report below. You can navigate through the pages in the report by either clicking on the pages listed below, or by using the keyword search tool below to find specific information within the annual report.-
 1
1 -
2
-
3
-
4
-
5
-
6
-
7
-
8
-
9
-
10
-
11
-
12
-
13
-
14
-
15
-
16
-
17
-
18
-
19
-
20
-
21
-
22
-
23
-
24
-
25
-
26
-
27
-
28
-
29
-
30
-
31
-
32
-
33
-
34
-
35
-
36
-
37
-
38
-
39
-
40
-
41
-
42
-
43
-
44
-
45
-
46
-
47
-
48
-
49
-
50
-
51
-
52
-
53
-
54
-
55
-
56
-
57
-
58
-
59
-
60
-
61
-
62
-
63
-
64
-
65
-
66
-
67
-
68
-
69
-
70
-
71
-
72
-
73
-
74
-
75
-
76
-
77
-
78
-
79
-
80
-
81
-
82
-
83
-
84
-
85
-
86
-
87
-
88
-
89
-
90
-
91
-
92
-
93
-
94
-
95
-
96
-
97
-
98
-
99
-
100
-
101
-
102
-
103
-
104
-
105
-
106
-
107
-
108
-
109
-
110
-
111
-
112
-
113
-
114
-
115
-
116
-
117
-
118
-
119
-
120
-
121
-
122
-
123
-
124
-
125
-
126
-
127
-
128
-
129
-
130
-
131
-
132
-
133
-
134
-
135
-
136
-
137
-
138
-
139
-
140
-
141
-
142
-
143
-
144
-
145
-
146
-
147
-
148
-
149
-
150
-
151
-
152
-
153
-
154
-
155
-
156
-
157
-
158
-
159
-
160
-
161
-
162
-
163
-
164
-
165
-
166
-
167
-
168
-
169
-
170
-
171
-
172
-
173
-
174
-
175
-
176
-
177
-
178
-
179
-
180
-
181
-
182
-
183
-
184
-
185
-
186
-
187
-
188
-
189
-
190
-
191
-
192
-
193
-
194
-
195
-
196
-
197
-
198
-
199
-
200
-
201
-
202
-
203
-
204
-
205
-
206
-
207
-
208
-
209
-
210
-
211
-
212
-
213
-
214
-
215
-
216
-
217
-
218
-
219
-
220
-
221
-
222
-
223
-
224
-
225
-
226
-
227
-
228
-
229
-
230
-
231
-
232
-
233
-
234
-
235
-
236
-
237
-
238
-
239
-
240
-
241
-
242
-
243
-
244
-
245
-
246
-
247
-
248
-
249
-
250
-
251
-
252
-
253
-
254
-
255
-
256
-
257
-
258
-
259
-
260
-
261
-
262
-
263
-
264
-
265
-
266
-
267
-
268
-
269
-
270
-
271
-
272
-
273
-
274
-
275
-
276
-
277
-
278
-
279
-
280
-
281
-
282
-
283
-
284
-
285
-
286
-
287
-
288
-
289
-
290
-
291
-
292
-
293
-
294
-
295
-
296
-
297
-
298
-
 299
299 -
 300
300 -
 301
301 -
 302
302 -
 303
303 -
 304
304 -
 305
305 -
 306
306 -
 307
307 -
 308
308 -
 309
309 -
 310
310 -
 311
311 -
 312
312 -
 313
313 -
 314
314 -
 315
315 -
 316
316 -
 317
317 -
 318
318 -
 319
319 -
320
-
321
-
322
-
323
-
324
-
325
-
326
-
327
-
328
-
329
-
330
-
331
-
332
-
333
-
334
-
335
-
336
-
337
-
338
-
339
-
340
-
341
-
342
-
343
-
344
-
345
-
346
-
347
-
348
-
349
-
350
-
351
-
352
-
353
-
354
-
355
-
356
-
357
-
358
-
359
-
360
-
361
-
362
-
363
-
364
-
365
-
366
-
367
-
368
-
369
-
370
-
371
-
372
-
373
-
374
-
375
-
376
-
377
-
378
-
379
-
380
-
381
-
382
-
383
-
384
-
385
-
386
-
387
-
388
-
389
-
390
-
391
-
392
-
393
-
394
-
395
-
396
-
397
-
398
-
399
-
400
-
401
-
402
-
403
-
404
-
405
-
406
-
407
-
408
-
409
-
410
-
411
-
412
-
413
-
414
-
415
-
416
-
417
-
418
-
419
-
420
-
421
-
422
-
423
-
424
-
425
-
426
-
427
-
428
-
429
-
430
-
431
-
432
-
433
-
434
-
435
-
436
-
437
-
438
-
439
-
440
-
441
-
442
-
443
-
444
-
445
-
446
-
447
-
448
-
449
-
450
-
451
-
452
-
453
-
454
-
455
-
456
-
457
-
458
-
459
-
460
-
461
-
462
-
463
-
464
-
465
-
466
-
467
-
468
-
469
-
470
-
471
-
472
-
473
-
474
-
475
-
476
-
477
-
478
-
479
-
480
-
481
-
482
-
483
-
484
-
485
-
486
-
487
-
488
-
489
-
490
-
491
-
492
-
493
-
494
-
495
-
496
-
497
-
498
-
499
-
500
-
501
-
502
-
503
-
504
-
505
-
506
-
507
-
508
-
509
-
510
-
511
-
512
-
513
-
514
-
515
-
516
-
517
-
518
-
519
-
520
-
521
-
522
-
523
-
524
-
525
-
526
-
527
-
528
-
529
-
530
-
531
-
532
-
533
-
534
-
535
-
536
-
537
-
538
-
539
-
540
-
541
-
542
-
543
-
544
-
545
-
546
-
547
-
548
-
549
-
550
-
551
-
552
-
553
-
554
-
555
-
556
-
557
-
558
-
559
-
560
-
561
-
562
-
563
-
564
 |
 |

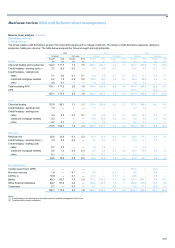
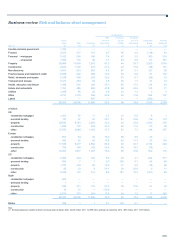
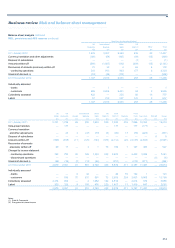
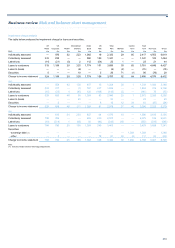
Business review Risk and balance sheet management
307
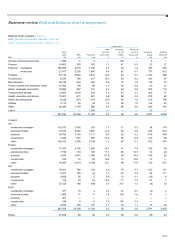
Sector and geographical regional analyses: Non-Core
Credit metrics
REIL Provisions Provisions
Gross as a % of as a % as a % of Impairment Amounts
loans REIL Provisions gross loans of REIL gross loans charge written-off
2013 £m £m £m %% % £m £m
Central and local government 1,153 — — — — — — —
Finance 1,285 200 109 15.6 55 8.5 (21) 45
Personal - mortgages 1,933 210 69 10.9 33 3.6 39 113
- unsecured 343 91 33 26.5 36 9.6 44 49
Property 19,122 14,701 10,715 76.9 73 56.0 3,783 1,177
Construction 1,257 626 357 49.8 57 28.4 128 63
Manufacturing 638 198 166 31.0 84 26.0 56 29
Finance leases and instalment credit 3,232 124 101 3.8 81 3.1 (7) 90
Retail, wholesale and repairs 675 360 252 53.3 70 37.3 59 14
Transport and storage 2,770 441 203 15.9 46 7.3 85 152
Health, education and leisure 603 453 265 75.1 58 43.9 84 37
Hotels and restaurants 704 617 338 87.6 55 48.0 126 36
Utilities 848 68 37 8.0 54 4.4 (11) —
Other 2,155 924 570 42.9 62 26.5 260 51
Latent — — 623 — — — 21 —
36,718 19,013 13,838 51.8 73 37.7 4,646 1,856
of which:
UK
- residential mortgages — — — — — — 1 1
- personal lending 24 24 21 100.0 88 87.5 6 6
- property 9,500 6,694 4,079 70.5 61 42.9 1,398 545
- construction 655 350 185 53.4 53 28.2 71 63
- other 8,054 1,376 1,058 17.1 77 13.1 279 136
Europe
- residential mortgages 193 19 18 9.8 95 9.3 — —
- personal lending 69 81 11.6 13 1.4 7 2
- property 9,224 7,931 6,593 86.0 83 71.5 2,385 607
- construction 601 276 172 45.9 62 28.6 59 —
- other 4,311 1,843 1,330 42.8 72 30.9 282 214
US
- residential mortgages 1,740 191 51 11.0 27 2.9 38 112
- personal lending 245 59 11 24.1 19 4.5 30 40
- property 221 47 14 21.3 30 6.3 4 17
- construction 1 — — — — — (2) —
- other 165 10 181 6.1 nm 109.7 73 59
RoW
- personal lending 5 — — — — — 1 1
- property 177 29 29 16.4 100 16.4 (4) 8
- other 1,533 156 95 10.2 61 6.2 18 45
36,718 19,013 13,838 51.8 73 37.7 4,646 1,856
Banks 431 11 0.2 100 0.2 — —
nm = not meaningful