RBS 2013 Annual Report Download - page 190
Download and view the complete annual report
Please find page 190 of the 2013 RBS annual report below. You can navigate through the pages in the report by either clicking on the pages listed below, or by using the keyword search tool below to find specific information within the annual report.-
 1
1 -
2
-
3
-
4
-
5
-
6
-
7
-
8
-
9
-
10
-
11
-
12
-
13
-
14
-
15
-
16
-
17
-
18
-
19
-
20
-
21
-
22
-
23
-
24
-
25
-
26
-
27
-
28
-
29
-
30
-
31
-
32
-
33
-
34
-
35
-
36
-
37
-
38
-
39
-
40
-
41
-
42
-
43
-
44
-
45
-
46
-
47
-
48
-
49
-
50
-
51
-
52
-
53
-
54
-
55
-
56
-
57
-
58
-
59
-
60
-
61
-
62
-
63
-
64
-
65
-
66
-
67
-
68
-
69
-
70
-
71
-
72
-
73
-
74
-
75
-
76
-
77
-
78
-
79
-
80
-
81
-
82
-
83
-
84
-
85
-
86
-
87
-
88
-
89
-
90
-
91
-
92
-
93
-
94
-
95
-
96
-
97
-
98
-
99
-
100
-
101
-
102
-
103
-
104
-
105
-
106
-
107
-
108
-
109
-
110
-
111
-
112
-
113
-
114
-
115
-
116
-
117
-
118
-
119
-
120
-
121
-
122
-
123
-
124
-
125
-
126
-
127
-
128
-
129
-
130
-
131
-
132
-
133
-
134
-
135
-
136
-
137
-
138
-
139
-
140
-
141
-
142
-
143
-
144
-
145
-
146
-
147
-
148
-
149
-
150
-
151
-
152
-
153
-
154
-
155
-
156
-
157
-
158
-
159
-
160
-
161
-
162
-
163
-
164
-
165
-
166
-
167
-
168
-
169
-
170
-
171
-
172
-
173
-
174
-
175
-
176
-
177
-
178
-
179
-
 180
180 -
 181
181 -
 182
182 -
 183
183 -
 184
184 -
 185
185 -
 186
186 -
 187
187 -
 188
188 -
 189
189 -
 190
190 -
 191
191 -
 192
192 -
 193
193 -
 194
194 -
 195
195 -
 196
196 -
 197
197 -
 198
198 -
 199
199 -
 200
200 -
201
-
202
-
203
-
204
-
205
-
206
-
207
-
208
-
209
-
210
-
211
-
212
-
213
-
214
-
215
-
216
-
217
-
218
-
219
-
220
-
221
-
222
-
223
-
224
-
225
-
226
-
227
-
228
-
229
-
230
-
231
-
232
-
233
-
234
-
235
-
236
-
237
-
238
-
239
-
240
-
241
-
242
-
243
-
244
-
245
-
246
-
247
-
248
-
249
-
250
-
251
-
252
-
253
-
254
-
255
-
256
-
257
-
258
-
259
-
260
-
261
-
262
-
263
-
264
-
265
-
266
-
267
-
268
-
269
-
270
-
271
-
272
-
273
-
274
-
275
-
276
-
277
-
278
-
279
-
280
-
281
-
282
-
283
-
284
-
285
-
286
-
287
-
288
-
289
-
290
-
291
-
292
-
293
-
294
-
295
-
296
-
297
-
298
-
299
-
300
-
301
-
302
-
303
-
304
-
305
-
306
-
307
-
308
-
309
-
310
-
311
-
312
-
313
-
314
-
315
-
316
-
317
-
318
-
319
-
320
-
321
-
322
-
323
-
324
-
325
-
326
-
327
-
328
-
329
-
330
-
331
-
332
-
333
-
334
-
335
-
336
-
337
-
338
-
339
-
340
-
341
-
342
-
343
-
344
-
345
-
346
-
347
-
348
-
349
-
350
-
351
-
352
-
353
-
354
-
355
-
356
-
357
-
358
-
359
-
360
-
361
-
362
-
363
-
364
-
365
-
366
-
367
-
368
-
369
-
370
-
371
-
372
-
373
-
374
-
375
-
376
-
377
-
378
-
379
-
380
-
381
-
382
-
383
-
384
-
385
-
386
-
387
-
388
-
389
-
390
-
391
-
392
-
393
-
394
-
395
-
396
-
397
-
398
-
399
-
400
-
401
-
402
-
403
-
404
-
405
-
406
-
407
-
408
-
409
-
410
-
411
-
412
-
413
-
414
-
415
-
416
-
417
-
418
-
419
-
420
-
421
-
422
-
423
-
424
-
425
-
426
-
427
-
428
-
429
-
430
-
431
-
432
-
433
-
434
-
435
-
436
-
437
-
438
-
439
-
440
-
441
-
442
-
443
-
444
-
445
-
446
-
447
-
448
-
449
-
450
-
451
-
452
-
453
-
454
-
455
-
456
-
457
-
458
-
459
-
460
-
461
-
462
-
463
-
464
-
465
-
466
-
467
-
468
-
469
-
470
-
471
-
472
-
473
-
474
-
475
-
476
-
477
-
478
-
479
-
480
-
481
-
482
-
483
-
484
-
485
-
486
-
487
-
488
-
489
-
490
-
491
-
492
-
493
-
494
-
495
-
496
-
497
-
498
-
499
-
500
-
501
-
502
-
503
-
504
-
505
-
506
-
507
-
508
-
509
-
510
-
511
-
512
-
513
-
514
-
515
-
516
-
517
-
518
-
519
-
520
-
521
-
522
-
523
-
524
-
525
-
526
-
527
-
528
-
529
-
530
-
531
-
532
-
533
-
534
-
535
-
536
-
537
-
538
-
539
-
540
-
541
-
542
-
543
-
544
-
545
-
546
-
547
-
548
-
549
-
550
-
551
-
552
-
553
-
554
-
555
-
556
-
557
-
558
-
559
-
560
-
561
-
562
-
563
-
564
 |
 |

Business review Risk and balance sheet management
188
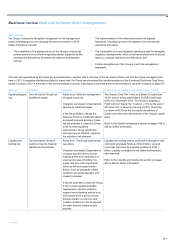
Risk appetite*: Risk coverage continued
Risk type Definition Features How the Group manages risk and the focus in 2013
Credit risk The risk of financial loss due
to the failure of a customer, or
counterparty, to meet its
obligation to settle outstanding
amounts.
Arises from: Deterioration of the credit
quality of customers or counterparties
of the Group, leaving them unable to
meet their contractual obligations.
Character and impact: Losses can vary
materially across portfolios and may
include the risk of loss due to the
concentration of credit risk related to a
specific product, asset class, sector or
counterparty.
It has the potential to affect adversely
the Group’s financial performance and
capital.
During 2013, loan impairment charges were £8.4 billion, of
which £4.5 billion related to the creation of RCR and the related
strategy. Excluding the increased impairments related to RCR,
loan impairment losses fell by £1.4 billion. Impairment
provisions covered risk elements in lending of £39.4 billion by
64%, up from 52% a year earlier. Credit risk RWAs fell by 16%
to £313.4 billion, within which counterparty risk RWAs more
than halved to £22.3 billion, reflecting risk reduction and core
product focus in Markets as well as Non-Core disposals and
run-off.
Credit risk is managed using a suite of credit approval, risk
concentration, early warning and problem management
frameworks as well as associated risk management tools.
The focus in 2013 was on the calibration of the credit control
framework to align with Group risk appetite targets and the
enhancement of existing Basel models.
Refer to the Credit risk and Balance sheet analysis sections on
pages 227 to 317 for further information.
Market risk The risk of loss arising from
fluctuations in interest rates,
credit spreads, foreign
currency rates, equity prices,
commodity prices and other
risk-related factors such as
market volatilities that may
lead to a reduction in
earnings, economic value or
both.
Arises from: Adverse movements in
market prices.
Character and impact: Characterised
by frequent small losses, which are
material in aggregate, and infrequent
large material losses due to stress
events.
It has the potential to materially affect
financial performance in Markets,
International Banking, Non-Core and
Group Treasury where the Group has
the majority of its exposures. The
Group’s non-trading activities in retail
and commercial businesses can also
be affected through interest rate risk
and foreign exchange non traded
exposures.
During 2013, the Group continued to reduce its risk exposures.
Average trading value-at-risk (VaR) decreased significantly
from £97 million to £79 million, reflecting risk reduction and
capital management focus. De-risking within the rates business
and improvements in the capture of valuation adjustment risks
within the counterparty exposure management desk in Markets
helped reduce VaR in the first half of 2013. Ongoing reductions
in the asset-backed securities inventory drove down the risk
even further in the second half of 2013.
Refer to the Market risk section on pages 318 to 340 for further
information.
*unaudited