RBS 2013 Annual Report Download - page 141
Download and view the complete annual report
Please find page 141 of the 2013 RBS annual report below. You can navigate through the pages in the report by either clicking on the pages listed below, or by using the keyword search tool below to find specific information within the annual report.-
 1
1 -
2
-
3
-
4
-
5
-
6
-
7
-
8
-
9
-
10
-
11
-
12
-
13
-
14
-
15
-
16
-
17
-
18
-
19
-
20
-
21
-
22
-
23
-
24
-
25
-
26
-
27
-
28
-
29
-
30
-
31
-
32
-
33
-
34
-
35
-
36
-
37
-
38
-
39
-
40
-
41
-
42
-
43
-
44
-
45
-
46
-
47
-
48
-
49
-
50
-
51
-
52
-
53
-
54
-
55
-
56
-
57
-
58
-
59
-
60
-
61
-
62
-
63
-
64
-
65
-
66
-
67
-
68
-
69
-
70
-
71
-
72
-
73
-
74
-
75
-
76
-
77
-
78
-
79
-
80
-
81
-
82
-
83
-
84
-
85
-
86
-
87
-
88
-
89
-
90
-
91
-
92
-
93
-
94
-
95
-
96
-
97
-
98
-
99
-
100
-
101
-
102
-
103
-
104
-
105
-
106
-
107
-
108
-
109
-
110
-
111
-
112
-
113
-
114
-
115
-
116
-
117
-
118
-
119
-
120
-
121
-
122
-
123
-
124
-
125
-
126
-
127
-
128
-
129
-
130
-
 131
131 -
 132
132 -
 133
133 -
 134
134 -
 135
135 -
 136
136 -
 137
137 -
 138
138 -
 139
139 -
 140
140 -
 141
141 -
 142
142 -
 143
143 -
 144
144 -
 145
145 -
 146
146 -
 147
147 -
 148
148 -
 149
149 -
 150
150 -
 151
151 -
152
-
153
-
154
-
155
-
156
-
157
-
158
-
159
-
160
-
161
-
162
-
163
-
164
-
165
-
166
-
167
-
168
-
169
-
170
-
171
-
172
-
173
-
174
-
175
-
176
-
177
-
178
-
179
-
180
-
181
-
182
-
183
-
184
-
185
-
186
-
187
-
188
-
189
-
190
-
191
-
192
-
193
-
194
-
195
-
196
-
197
-
198
-
199
-
200
-
201
-
202
-
203
-
204
-
205
-
206
-
207
-
208
-
209
-
210
-
211
-
212
-
213
-
214
-
215
-
216
-
217
-
218
-
219
-
220
-
221
-
222
-
223
-
224
-
225
-
226
-
227
-
228
-
229
-
230
-
231
-
232
-
233
-
234
-
235
-
236
-
237
-
238
-
239
-
240
-
241
-
242
-
243
-
244
-
245
-
246
-
247
-
248
-
249
-
250
-
251
-
252
-
253
-
254
-
255
-
256
-
257
-
258
-
259
-
260
-
261
-
262
-
263
-
264
-
265
-
266
-
267
-
268
-
269
-
270
-
271
-
272
-
273
-
274
-
275
-
276
-
277
-
278
-
279
-
280
-
281
-
282
-
283
-
284
-
285
-
286
-
287
-
288
-
289
-
290
-
291
-
292
-
293
-
294
-
295
-
296
-
297
-
298
-
299
-
300
-
301
-
302
-
303
-
304
-
305
-
306
-
307
-
308
-
309
-
310
-
311
-
312
-
313
-
314
-
315
-
316
-
317
-
318
-
319
-
320
-
321
-
322
-
323
-
324
-
325
-
326
-
327
-
328
-
329
-
330
-
331
-
332
-
333
-
334
-
335
-
336
-
337
-
338
-
339
-
340
-
341
-
342
-
343
-
344
-
345
-
346
-
347
-
348
-
349
-
350
-
351
-
352
-
353
-
354
-
355
-
356
-
357
-
358
-
359
-
360
-
361
-
362
-
363
-
364
-
365
-
366
-
367
-
368
-
369
-
370
-
371
-
372
-
373
-
374
-
375
-
376
-
377
-
378
-
379
-
380
-
381
-
382
-
383
-
384
-
385
-
386
-
387
-
388
-
389
-
390
-
391
-
392
-
393
-
394
-
395
-
396
-
397
-
398
-
399
-
400
-
401
-
402
-
403
-
404
-
405
-
406
-
407
-
408
-
409
-
410
-
411
-
412
-
413
-
414
-
415
-
416
-
417
-
418
-
419
-
420
-
421
-
422
-
423
-
424
-
425
-
426
-
427
-
428
-
429
-
430
-
431
-
432
-
433
-
434
-
435
-
436
-
437
-
438
-
439
-
440
-
441
-
442
-
443
-
444
-
445
-
446
-
447
-
448
-
449
-
450
-
451
-
452
-
453
-
454
-
455
-
456
-
457
-
458
-
459
-
460
-
461
-
462
-
463
-
464
-
465
-
466
-
467
-
468
-
469
-
470
-
471
-
472
-
473
-
474
-
475
-
476
-
477
-
478
-
479
-
480
-
481
-
482
-
483
-
484
-
485
-
486
-
487
-
488
-
489
-
490
-
491
-
492
-
493
-
494
-
495
-
496
-
497
-
498
-
499
-
500
-
501
-
502
-
503
-
504
-
505
-
506
-
507
-
508
-
509
-
510
-
511
-
512
-
513
-
514
-
515
-
516
-
517
-
518
-
519
-
520
-
521
-
522
-
523
-
524
-
525
-
526
-
527
-
528
-
529
-
530
-
531
-
532
-
533
-
534
-
535
-
536
-
537
-
538
-
539
-
540
-
541
-
542
-
543
-
544
-
545
-
546
-
547
-
548
-
549
-
550
-
551
-
552
-
553
-
554
-
555
-
556
-
557
-
558
-
559
-
560
-
561
-
562
-
563
-
564
 |
 |

Business review
139
2013 saw a major shake-up of the UK financial advice landscape with the
implementation of the Retail Distribution Review (RDR). Clients
welcomed Coutts’ new fully compliant advice-led model where Coutts
requires its advisers to achieve the more stringent Level 6 rating, in
excess of the FCA’s minimum Level 4 requirement. Coutts has received a
number of industry accolades for its levels of service, such as ‘UK Private
Bank of the Year’ (The Banker Global Private Banking Awards). Total
assets under advice grew to approximately £3 billion over the year.
Following the deposit re-pricing strategy implemented in the second half
of 2013 deposit margins have significantly improved. Lending volumes
have remained resilient despite pay-downs in line with best-advice policy
under RDR. In addition, a new international trust strategy was
announced, strengthening the client offering by positioning it as a market-
leading, client-centric trust business. This was achieved by the creation of
a centre of excellence in Jersey, accompanied by withdrawal from the
Cayman Islands and restructuring of the Geneva trust business.
Work continued on streamlining client-facing processes and driving
increased benefits from the division’s global technology platform,
including significant enhancements to Coutts’ online and digital client
channels. A streamlining of the London property footprint from 11
buildings to 2 was also concluded, alongside further office rationalisation
in the International business.
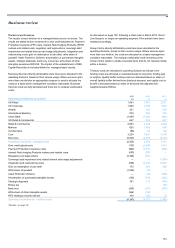
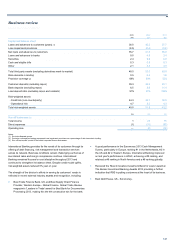
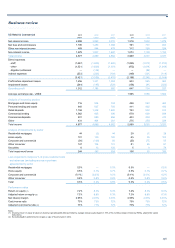
2013 compared with 2012
Operating profit was 9% lower at £221 million, driven by lower income
partially offset by a decrease in expenses and impairment losses.
Income declined by 7% to £1,093 million, with the reduction in net interest
income reflecting the lower spread earned on deposits as a result of
lower Group funding requirements.
Non-interest income fell by 7% to £419 million due to the disposal of the
Latin American, Caribbean and African businesses for a profit of £15
million in H1 2012 together with a decline in fee income in the
International business.
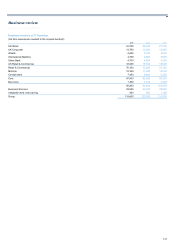
Expenses were 4% lower at £843 million as a result of reduced
headcount, tight discretionary cost management and the non-recurrence
of two regulatory fines totalling £26 million incurred during 2012. This was
partially offset by a one-off UK tax treaty charge in the International
business.
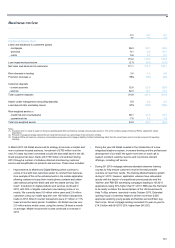
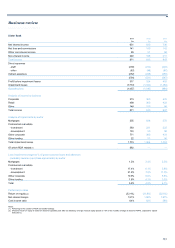
Client assets and liabilities managed by the division declined by 2%, with
a £1.7 billion reduction in deposits following re-pricing initiatives in the UK
in line with the wider Group funding strategy. Assets under management
increased by 3% due to positive market movements. Lending was 2%
lower, reflecting increased levels of repayments in the UK.
Impairments were £17 million lower at £29 million, largely reflecting a
small number of specific impairments.
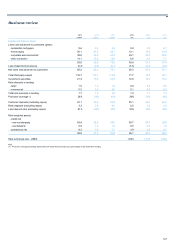
2012 compared with 2011
Operating profit increased by £1 million to £243 million driven by higher
income partially offset by increased expenses and impairment losses.
Total income increased by £66 million, with net interest income up £75
million, largely driven by improvements in margins and strong divisional
treasury income, particularly during H1 2012.
Non-interest income fell by 2% as the gain from the disposal of the Latin
American, Caribbean and African businesses was more than offset by a
decline in fee income in the UK and lower investment volumes, driven by
continued economic uncertainty.
Expenses were £44 million or 5% higher at £881 million, with significant
investment in change programmes, including the development of new
products and services capability and the implementation of RDR in the
UK.
Expenses also increased as a result of client redress following a past
business review into the sale of the ALICO Enhanced Variable Rate Fund
announced in November 2011 and a Financial Services Authority fine of
£8.75 million relating to Anti Money Laundering control processes.
Client assets and liabilities fell by 1% with a £2 billion decrease in assets
under management, primarily reflecting low margin client outflows of £1.4
billion and the impact of client transfers following the disposal of the Latin
American, Caribbean and African businesses. This fall was partially offset
by increases in lending and deposit volumes.
Impairment losses were £46 million, up £21 million, largely reflecting a
small number of large specific impairments.