RBS 2013 Annual Report Download - page 148
Download and view the complete annual report
Please find page 148 of the 2013 RBS annual report below. You can navigate through the pages in the report by either clicking on the pages listed below, or by using the keyword search tool below to find specific information within the annual report.-
 1
1 -
2
-
3
-
4
-
5
-
6
-
7
-
8
-
9
-
10
-
11
-
12
-
13
-
14
-
15
-
16
-
17
-
18
-
19
-
20
-
21
-
22
-
23
-
24
-
25
-
26
-
27
-
28
-
29
-
30
-
31
-
32
-
33
-
34
-
35
-
36
-
37
-
38
-
39
-
40
-
41
-
42
-
43
-
44
-
45
-
46
-
47
-
48
-
49
-
50
-
51
-
52
-
53
-
54
-
55
-
56
-
57
-
58
-
59
-
60
-
61
-
62
-
63
-
64
-
65
-
66
-
67
-
68
-
69
-
70
-
71
-
72
-
73
-
74
-
75
-
76
-
77
-
78
-
79
-
80
-
81
-
82
-
83
-
84
-
85
-
86
-
87
-
88
-
89
-
90
-
91
-
92
-
93
-
94
-
95
-
96
-
97
-
98
-
99
-
100
-
101
-
102
-
103
-
104
-
105
-
106
-
107
-
108
-
109
-
110
-
111
-
112
-
113
-
114
-
115
-
116
-
117
-
118
-
119
-
120
-
121
-
122
-
123
-
124
-
125
-
126
-
127
-
128
-
129
-
130
-
131
-
132
-
133
-
134
-
135
-
136
-
137
-
 138
138 -
 139
139 -
 140
140 -
 141
141 -
 142
142 -
 143
143 -
 144
144 -
 145
145 -
 146
146 -
 147
147 -
 148
148 -
 149
149 -
 150
150 -
 151
151 -
 152
152 -
 153
153 -
 154
154 -
 155
155 -
 156
156 -
 157
157 -
 158
158 -
159
-
160
-
161
-
162
-
163
-
164
-
165
-
166
-
167
-
168
-
169
-
170
-
171
-
172
-
173
-
174
-
175
-
176
-
177
-
178
-
179
-
180
-
181
-
182
-
183
-
184
-
185
-
186
-
187
-
188
-
189
-
190
-
191
-
192
-
193
-
194
-
195
-
196
-
197
-
198
-
199
-
200
-
201
-
202
-
203
-
204
-
205
-
206
-
207
-
208
-
209
-
210
-
211
-
212
-
213
-
214
-
215
-
216
-
217
-
218
-
219
-
220
-
221
-
222
-
223
-
224
-
225
-
226
-
227
-
228
-
229
-
230
-
231
-
232
-
233
-
234
-
235
-
236
-
237
-
238
-
239
-
240
-
241
-
242
-
243
-
244
-
245
-
246
-
247
-
248
-
249
-
250
-
251
-
252
-
253
-
254
-
255
-
256
-
257
-
258
-
259
-
260
-
261
-
262
-
263
-
264
-
265
-
266
-
267
-
268
-
269
-
270
-
271
-
272
-
273
-
274
-
275
-
276
-
277
-
278
-
279
-
280
-
281
-
282
-
283
-
284
-
285
-
286
-
287
-
288
-
289
-
290
-
291
-
292
-
293
-
294
-
295
-
296
-
297
-
298
-
299
-
300
-
301
-
302
-
303
-
304
-
305
-
306
-
307
-
308
-
309
-
310
-
311
-
312
-
313
-
314
-
315
-
316
-
317
-
318
-
319
-
320
-
321
-
322
-
323
-
324
-
325
-
326
-
327
-
328
-
329
-
330
-
331
-
332
-
333
-
334
-
335
-
336
-
337
-
338
-
339
-
340
-
341
-
342
-
343
-
344
-
345
-
346
-
347
-
348
-
349
-
350
-
351
-
352
-
353
-
354
-
355
-
356
-
357
-
358
-
359
-
360
-
361
-
362
-
363
-
364
-
365
-
366
-
367
-
368
-
369
-
370
-
371
-
372
-
373
-
374
-
375
-
376
-
377
-
378
-
379
-
380
-
381
-
382
-
383
-
384
-
385
-
386
-
387
-
388
-
389
-
390
-
391
-
392
-
393
-
394
-
395
-
396
-
397
-
398
-
399
-
400
-
401
-
402
-
403
-
404
-
405
-
406
-
407
-
408
-
409
-
410
-
411
-
412
-
413
-
414
-
415
-
416
-
417
-
418
-
419
-
420
-
421
-
422
-
423
-
424
-
425
-
426
-
427
-
428
-
429
-
430
-
431
-
432
-
433
-
434
-
435
-
436
-
437
-
438
-
439
-
440
-
441
-
442
-
443
-
444
-
445
-
446
-
447
-
448
-
449
-
450
-
451
-
452
-
453
-
454
-
455
-
456
-
457
-
458
-
459
-
460
-
461
-
462
-
463
-
464
-
465
-
466
-
467
-
468
-
469
-
470
-
471
-
472
-
473
-
474
-
475
-
476
-
477
-
478
-
479
-
480
-
481
-
482
-
483
-
484
-
485
-
486
-
487
-
488
-
489
-
490
-
491
-
492
-
493
-
494
-
495
-
496
-
497
-
498
-
499
-
500
-
501
-
502
-
503
-
504
-
505
-
506
-
507
-
508
-
509
-
510
-
511
-
512
-
513
-
514
-
515
-
516
-
517
-
518
-
519
-
520
-
521
-
522
-
523
-
524
-
525
-
526
-
527
-
528
-
529
-
530
-
531
-
532
-
533
-
534
-
535
-
536
-
537
-
538
-
539
-
540
-
541
-
542
-
543
-
544
-
545
-
546
-
547
-
548
-
549
-
550
-
551
-
552
-
553
-
554
-
555
-
556
-
557
-
558
-
559
-
560
-
561
-
562
-
563
-
564
 |
 |

Business review
146
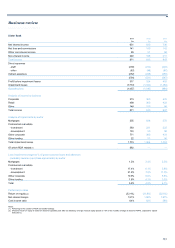
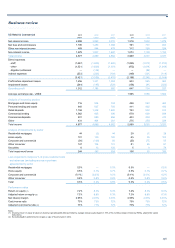
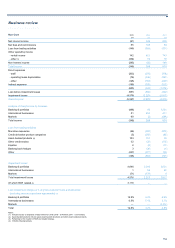
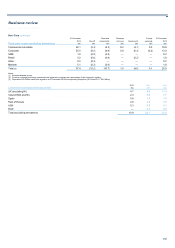
US Retail & Commercial 2013 2012 2011 2013 2012 2011
US$m US$m US$m £m £m £m
Net interest income 2,998 3,062 3,015 1,916 1,932 1,879
Net fees and commissions 1,190 1,253 1,368 761 791 853
Other non-interest income 489 584 479 312 368 299
Non-interest income 1,679 1,837 1,847 1,073 1,159 1,152
Total income 4,677 4,899 4,862 2,989 3,091 3,031
Direct expenses
- staff (1,667) (1,605) (1,620) (1,065) (1,013) (1,010)
- other (1,521) (1,609) (1,674) (972) (1,014) (1,044)
- litigation settlement —(138) —— (88) —
Indirect expenses (233) (206) (184) (149) (131) (114)
(3,421) (3,558) (3,478) (2,186) (2,246) (2,168)
Profit before impairment losses 1,256 1,341 1,384 803 845 863
Impairment losses (244) (145) (524) (156) (91) (326)
Operating profit 1,012 1,196 860 647 754 537
A
verage exchange rate - US$/£ 1.565 1.585 1.604
A
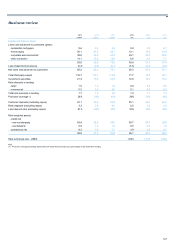
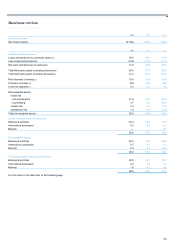
nalysis of income by product
Mortgages and home equity 716 856 744 458 540 463
Personal lending and cards 643 637 700 411 402 436
Retail deposits 1,194 1,348 1,465 763 852 914
Commercial lending 1,062 965 936 679 609 584
Commercial deposits 631 689 656 403 434 410
Other 431 404 361 275 254 224
Total income 4,677 4,899 4,862 2,989 3,091 3,031
A
nalysis of impairments by secto
r
Residential mortgages 44 (2) 44 28 (1) 28
Home equity 101 150 165 65 95 103
Corporate and commercial (36) (120) 88 (23) (77) 55
Other consumer 127 104 101 81 65 61
Securities 813 126 5 9 79
Total impairment losses 244 145 524 156 91 326
Loan impairment charge as % of gross customer loans
and advances (excluding reverse repurchase
agreements) by sector
Residential mortgages 0.5% — 0.5% 0.5% — 0.5%
Home equity 0.5% 0.7% 0.7% 0.5% 0.7% 0.7%
Corporate and commercial (0.1%) (0.3%) 0.2% (0.1%) (0.3%) 0.2%
Other consumer 0.9% 0.8% 0.8% 0.9% 0.8% 0.8%
Total 0.3% 0.2% 0.5% 0.3% 0.2% 0.5%
Performance ratios
Return on equity (1) 7.2% 8.3% 6.3% 7.2% 8.3% 6.3%
A
djusted return on equity (2) 7.2% 8.9% 6.3% 7.2% 8.9% 6.3%
Net interest margin 2.95% 2.97% 3.03% 2.95% 2.97% 3.03%
Cost:income ratio 73% 73% 72% 73% 73% 72%
A
djusted cost:income ratio (2) 73% 71% 72% 73% 71% 72%
Notes:
(1) Divisional return on equity is based on divisional operating profit after tax divided by average notional equity (based on 10% of the monthly average of divisional RWAs, adjusted for capital
deductions).
(2) Excludes litigation settlement and net gain on sale of Visa B shares in 2012.