RBS 2013 Annual Report Download - page 112
Download and view the complete annual report
Please find page 112 of the 2013 RBS annual report below. You can navigate through the pages in the report by either clicking on the pages listed below, or by using the keyword search tool below to find specific information within the annual report.-
 1
1 -
2
-
3
-
4
-
5
-
6
-
7
-
8
-
9
-
10
-
11
-
12
-
13
-
14
-
15
-
16
-
17
-
18
-
19
-
20
-
21
-
22
-
23
-
24
-
25
-
26
-
27
-
28
-
29
-
30
-
31
-
32
-
33
-
34
-
35
-
36
-
37
-
38
-
39
-
40
-
41
-
42
-
43
-
44
-
45
-
46
-
47
-
48
-
49
-
50
-
51
-
52
-
53
-
54
-
55
-
56
-
57
-
58
-
59
-
60
-
61
-
62
-
63
-
64
-
65
-
66
-
67
-
68
-
69
-
70
-
71
-
72
-
73
-
74
-
75
-
76
-
77
-
78
-
79
-
80
-
81
-
82
-
83
-
84
-
85
-
86
-
87
-
88
-
89
-
90
-
91
-
92
-
93
-
94
-
95
-
96
-
97
-
98
-
99
-
100
-
101
-
 102
102 -
 103
103 -
 104
104 -
 105
105 -
 106
106 -
 107
107 -
 108
108 -
 109
109 -
 110
110 -
 111
111 -
 112
112 -
 113
113 -
 114
114 -
 115
115 -
 116
116 -
 117
117 -
 118
118 -
 119
119 -
 120
120 -
 121
121 -
 122
122 -
123
-
124
-
125
-
126
-
127
-
128
-
129
-
130
-
131
-
132
-
133
-
134
-
135
-
136
-
137
-
138
-
139
-
140
-
141
-
142
-
143
-
144
-
145
-
146
-
147
-
148
-
149
-
150
-
151
-
152
-
153
-
154
-
155
-
156
-
157
-
158
-
159
-
160
-
161
-
162
-
163
-
164
-
165
-
166
-
167
-
168
-
169
-
170
-
171
-
172
-
173
-
174
-
175
-
176
-
177
-
178
-
179
-
180
-
181
-
182
-
183
-
184
-
185
-
186
-
187
-
188
-
189
-
190
-
191
-
192
-
193
-
194
-
195
-
196
-
197
-
198
-
199
-
200
-
201
-
202
-
203
-
204
-
205
-
206
-
207
-
208
-
209
-
210
-
211
-
212
-
213
-
214
-
215
-
216
-
217
-
218
-
219
-
220
-
221
-
222
-
223
-
224
-
225
-
226
-
227
-
228
-
229
-
230
-
231
-
232
-
233
-
234
-
235
-
236
-
237
-
238
-
239
-
240
-
241
-
242
-
243
-
244
-
245
-
246
-
247
-
248
-
249
-
250
-
251
-
252
-
253
-
254
-
255
-
256
-
257
-
258
-
259
-
260
-
261
-
262
-
263
-
264
-
265
-
266
-
267
-
268
-
269
-
270
-
271
-
272
-
273
-
274
-
275
-
276
-
277
-
278
-
279
-
280
-
281
-
282
-
283
-
284
-
285
-
286
-
287
-
288
-
289
-
290
-
291
-
292
-
293
-
294
-
295
-
296
-
297
-
298
-
299
-
300
-
301
-
302
-
303
-
304
-
305
-
306
-
307
-
308
-
309
-
310
-
311
-
312
-
313
-
314
-
315
-
316
-
317
-
318
-
319
-
320
-
321
-
322
-
323
-
324
-
325
-
326
-
327
-
328
-
329
-
330
-
331
-
332
-
333
-
334
-
335
-
336
-
337
-
338
-
339
-
340
-
341
-
342
-
343
-
344
-
345
-
346
-
347
-
348
-
349
-
350
-
351
-
352
-
353
-
354
-
355
-
356
-
357
-
358
-
359
-
360
-
361
-
362
-
363
-
364
-
365
-
366
-
367
-
368
-
369
-
370
-
371
-
372
-
373
-
374
-
375
-
376
-
377
-
378
-
379
-
380
-
381
-
382
-
383
-
384
-
385
-
386
-
387
-
388
-
389
-
390
-
391
-
392
-
393
-
394
-
395
-
396
-
397
-
398
-
399
-
400
-
401
-
402
-
403
-
404
-
405
-
406
-
407
-
408
-
409
-
410
-
411
-
412
-
413
-
414
-
415
-
416
-
417
-
418
-
419
-
420
-
421
-
422
-
423
-
424
-
425
-
426
-
427
-
428
-
429
-
430
-
431
-
432
-
433
-
434
-
435
-
436
-
437
-
438
-
439
-
440
-
441
-
442
-
443
-
444
-
445
-
446
-
447
-
448
-
449
-
450
-
451
-
452
-
453
-
454
-
455
-
456
-
457
-
458
-
459
-
460
-
461
-
462
-
463
-
464
-
465
-
466
-
467
-
468
-
469
-
470
-
471
-
472
-
473
-
474
-
475
-
476
-
477
-
478
-
479
-
480
-
481
-
482
-
483
-
484
-
485
-
486
-
487
-
488
-
489
-
490
-
491
-
492
-
493
-
494
-
495
-
496
-
497
-
498
-
499
-
500
-
501
-
502
-
503
-
504
-
505
-
506
-
507
-
508
-
509
-
510
-
511
-
512
-
513
-
514
-
515
-
516
-
517
-
518
-
519
-
520
-
521
-
522
-
523
-
524
-
525
-
526
-
527
-
528
-
529
-
530
-
531
-
532
-
533
-
534
-
535
-
536
-
537
-
538
-
539
-
540
-
541
-
542
-
543
-
544
-
545
-
546
-
547
-
548
-
549
-
550
-
551
-
552
-
553
-
554
-
555
-
556
-
557
-
558
-
559
-
560
-
561
-
562
-
563
-
564
 |
 |

Business review
110
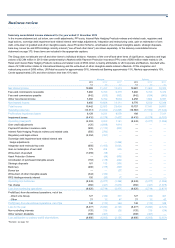
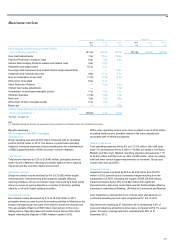
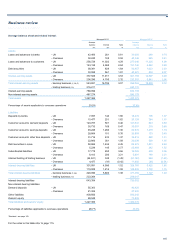
Summary consolidated income statement for the year ended 31 December 2013
In the income statement set out below, own credit adjustments, PPI costs, Interest Rate Hedging Products redress and related costs, regulatory and
legal actions, sovereign debt impairment and related interest rate hedge adjustments, integration and restructuring costs, gain on redemption of own
debt, write-down of goodwill and other intangible assets, Asset Protection Scheme, amortisation of purchased intangible assets, strategic disposals,
bank levy, bonus tax and RFS Holdings minority interest (“one-off and other items”) are shown separately. In the statutory consolidated income
statement on page 370, these items are included in the appropriate captions.
The Group does not allocate one-off and other items to individual divisions. However, of the one-off and other items of significance, regulatory and legal
actions of £2,394 million in 2013 relate predominantly to Markets while Payment Protection Insurance (PPI) costs of £900 million relate mainly to UK
Retail and Interest Rate Hedging Products redress and related costs of £550 million is mainly attributable to UK Corporate and Markets. Goodwill write-
down of £1,059 million relates to International Banking and the write-down of other intangible assets relates to Markets. Of the integration and
restructuring costs of £656 million, UK Retail accounts for approximately 30%, International Banking approximately 15%, Markets approximately 10%,
Centre approximately 23% and other divisions less than 10% each.
Managed Statutory
2013 2012* 2011* 2013 2012* 2011*
£m £m £m £m £m £m
Net interest income 10,992 11,417 12,313 10,981 11,402 12,303
Fees and commissions receivable 5,460 5,709 6,379 5,460 5,709 6,379
Fees and commissions payable (942) (833) (962) (942) (834) (962)
Other non-interest income 3,932 5,792 5,694 4,258 1,664 6,931
Non-interest income 8,450 10,668 11,111 8,776 6,539 12,348
Total income 19,442 22,085 23,424 19,757 17,941 24,651
Operating expenses (13,313) (13,854) (14,846) (19,568) (17,939) (17,340)
Profit before impairment losses 6,129 8,231 8,578 189 2 7,311
Impairment losses (8,432) (5,279) (7,437) (8,432) (5,279) (8,707)
Operating (loss)/profit (2,303) 2,952 1,141 (8,243) (5,277) (1,396)
Own credit adjustments (120) (4,649) 1,914 — — —
Payment Protection Insurance costs (900) (1,110) (850) — — —
Interest Rate Hedging Products redress and related costs (550) (700) — — — —
Regulatory and legal actions (2,394) (381) — — — —
Sovereign debt impairment and related interest rate
hedge adjustments —— (1,268) — — —
Integration and restructuring costs (656) (1,415) (1,021) — — —
Gain on redemption of own debt 175 454 255 — — —
Write-down of goodwill (1,059) (18) — — — —
A
sset Protection Scheme —(44) (906) — — —
A
mortisation of purchased intangible assets (153) (178) (222) — — —
Strategic disposals 161 113 (105) — — —
Bank levy (200) (175) (300) — — —
Bonus tax —— (27) — — —
Write-down of other intangible assets (344) (106) — — — —
RFS Holdings minority interest 100 (20) (7) — — —
Operating loss before tax (8,243) (5,277) (1,396) (8,243) (5,277) (1,396)
Tax charge (382) (441) (1,075) (382) (441) (1,075)
Loss from continuing operations (8,625) (5,718) (2,471) (8,625) (5,718) (2,471)
Profit/(loss) from discontinued operations, net of tax
- Direct Line Group 127 (184) 301 127 (184) 301
- Other 21 12 47 21 12 47
Profit/(loss) from discontinued operations, net of tax 148 (172) 348 148 (172) 348
Loss for the year (8,477) (5,890) (2,123) (8,477) (5,890) (2,123)
Non-controlling interests (120) 136 (28) (120) 136 (28)
Other owners’ dividends (398) (301) — (398) (301) —
Loss attributable to ordinary and B shareholders (8,995) (6,055) (2,151) (8,995) (6,055) (2,151)
*Restated - see page 102.