RBS 2013 Annual Report Download - page 204
Download and view the complete annual report
Please find page 204 of the 2013 RBS annual report below. You can navigate through the pages in the report by either clicking on the pages listed below, or by using the keyword search tool below to find specific information within the annual report.-
 1
1 -
2
-
3
-
4
-
5
-
6
-
7
-
8
-
9
-
10
-
11
-
12
-
13
-
14
-
15
-
16
-
17
-
18
-
19
-
20
-
21
-
22
-
23
-
24
-
25
-
26
-
27
-
28
-
29
-
30
-
31
-
32
-
33
-
34
-
35
-
36
-
37
-
38
-
39
-
40
-
41
-
42
-
43
-
44
-
45
-
46
-
47
-
48
-
49
-
50
-
51
-
52
-
53
-
54
-
55
-
56
-
57
-
58
-
59
-
60
-
61
-
62
-
63
-
64
-
65
-
66
-
67
-
68
-
69
-
70
-
71
-
72
-
73
-
74
-
75
-
76
-
77
-
78
-
79
-
80
-
81
-
82
-
83
-
84
-
85
-
86
-
87
-
88
-
89
-
90
-
91
-
92
-
93
-
94
-
95
-
96
-
97
-
98
-
99
-
100
-
101
-
102
-
103
-
104
-
105
-
106
-
107
-
108
-
109
-
110
-
111
-
112
-
113
-
114
-
115
-
116
-
117
-
118
-
119
-
120
-
121
-
122
-
123
-
124
-
125
-
126
-
127
-
128
-
129
-
130
-
131
-
132
-
133
-
134
-
135
-
136
-
137
-
138
-
139
-
140
-
141
-
142
-
143
-
144
-
145
-
146
-
147
-
148
-
149
-
150
-
151
-
152
-
153
-
154
-
155
-
156
-
157
-
158
-
159
-
160
-
161
-
162
-
163
-
164
-
165
-
166
-
167
-
168
-
169
-
170
-
171
-
172
-
173
-
174
-
175
-
176
-
177
-
178
-
179
-
180
-
181
-
182
-
183
-
184
-
185
-
186
-
187
-
188
-
189
-
190
-
191
-
192
-
193
-
 194
194 -
 195
195 -
 196
196 -
 197
197 -
 198
198 -
 199
199 -
 200
200 -
 201
201 -
 202
202 -
 203
203 -
 204
204 -
 205
205 -
 206
206 -
 207
207 -
 208
208 -
 209
209 -
 210
210 -
 211
211 -
 212
212 -
 213
213 -
 214
214 -
215
-
216
-
217
-
218
-
219
-
220
-
221
-
222
-
223
-
224
-
225
-
226
-
227
-
228
-
229
-
230
-
231
-
232
-
233
-
234
-
235
-
236
-
237
-
238
-
239
-
240
-
241
-
242
-
243
-
244
-
245
-
246
-
247
-
248
-
249
-
250
-
251
-
252
-
253
-
254
-
255
-
256
-
257
-
258
-
259
-
260
-
261
-
262
-
263
-
264
-
265
-
266
-
267
-
268
-
269
-
270
-
271
-
272
-
273
-
274
-
275
-
276
-
277
-
278
-
279
-
280
-
281
-
282
-
283
-
284
-
285
-
286
-
287
-
288
-
289
-
290
-
291
-
292
-
293
-
294
-
295
-
296
-
297
-
298
-
299
-
300
-
301
-
302
-
303
-
304
-
305
-
306
-
307
-
308
-
309
-
310
-
311
-
312
-
313
-
314
-
315
-
316
-
317
-
318
-
319
-
320
-
321
-
322
-
323
-
324
-
325
-
326
-
327
-
328
-
329
-
330
-
331
-
332
-
333
-
334
-
335
-
336
-
337
-
338
-
339
-
340
-
341
-
342
-
343
-
344
-
345
-
346
-
347
-
348
-
349
-
350
-
351
-
352
-
353
-
354
-
355
-
356
-
357
-
358
-
359
-
360
-
361
-
362
-
363
-
364
-
365
-
366
-
367
-
368
-
369
-
370
-
371
-
372
-
373
-
374
-
375
-
376
-
377
-
378
-
379
-
380
-
381
-
382
-
383
-
384
-
385
-
386
-
387
-
388
-
389
-
390
-
391
-
392
-
393
-
394
-
395
-
396
-
397
-
398
-
399
-
400
-
401
-
402
-
403
-
404
-
405
-
406
-
407
-
408
-
409
-
410
-
411
-
412
-
413
-
414
-
415
-
416
-
417
-
418
-
419
-
420
-
421
-
422
-
423
-
424
-
425
-
426
-
427
-
428
-
429
-
430
-
431
-
432
-
433
-
434
-
435
-
436
-
437
-
438
-
439
-
440
-
441
-
442
-
443
-
444
-
445
-
446
-
447
-
448
-
449
-
450
-
451
-
452
-
453
-
454
-
455
-
456
-
457
-
458
-
459
-
460
-
461
-
462
-
463
-
464
-
465
-
466
-
467
-
468
-
469
-
470
-
471
-
472
-
473
-
474
-
475
-
476
-
477
-
478
-
479
-
480
-
481
-
482
-
483
-
484
-
485
-
486
-
487
-
488
-
489
-
490
-
491
-
492
-
493
-
494
-
495
-
496
-
497
-
498
-
499
-
500
-
501
-
502
-
503
-
504
-
505
-
506
-
507
-
508
-
509
-
510
-
511
-
512
-
513
-
514
-
515
-
516
-
517
-
518
-
519
-
520
-
521
-
522
-
523
-
524
-
525
-
526
-
527
-
528
-
529
-
530
-
531
-
532
-
533
-
534
-
535
-
536
-
537
-
538
-
539
-
540
-
541
-
542
-
543
-
544
-
545
-
546
-
547
-
548
-
549
-
550
-
551
-
552
-
553
-
554
-
555
-
556
-
557
-
558
-
559
-
560
-
561
-
562
-
563
-
564
 |
 |

Business review Risk and balance sheet management
202
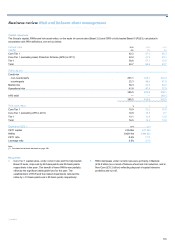
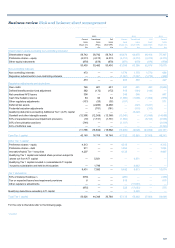
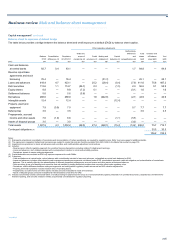
Capital management* continued
Estimated leverage ratio continued
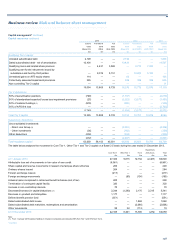
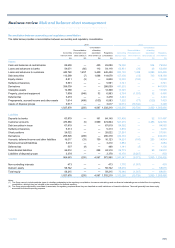
Off-balance sheet items
UK UK International US Retail &
Retail Corporate Banking (1) Commercial Markets Other Total
2013 £bn £bn £bn £bn £bn £bn £bn
Unconditionally cancellable items (2) 3.1 0.5 0.6 1.7 — 0.3 6.2
Other contingents and commitments 9.6 36.3 95.4 16.8 8.9 12.7 179.7
12.7 36.8 96.0 18.5 8.9 13.0 185.9
2012
Unconditionally cancellable items (2) 3.0 0.5 0.8 1.8 — 0.6 6.7
Other contingents and commitments 9.3 33.9 102.6 15.6 12.3 7.1 180.8
12.3 34.4 103.4 17.4 12.3 7.7 187.5
Notes:
(1) International Banking facilities are primarily undrawn facilities to large multinational corporations, many of which are domiciled in the UK.
(2) Based on a 10% credit conversion factor.
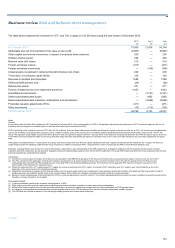
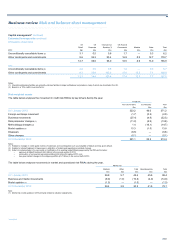
Risk-weighted assets
The table below analyses the movement in credit risk RWAs by key drivers during the year.
Credit risk
Non-counterparty Counterparty Total
£bn £bn £bn
A
t 1 January 2013 323.2 48.0 371.2
Foreign exchange movement (1.7) (0.3) (2.0)
Business movements (27.4) (4.9) (32.3)
Risk parameter changes (1) (11.0) (2.9) (13.9)
Methodology changes (2) 1.4 (16.1) (14.7)
Model updates (3) 15.3 (1.5) 13.8
Disposals (8.6) — (8.6)
Other changes (0.1) — (0.1)
A
t 31 December 2013 291.1 22.3 313.4
Notes:
(1) Relates to changes in credit quality metrics of customers and counterparties such as probability of default and loss given default.
(2) Relates to internal treatment of exposures or calibration of models and regulatory prescribed changes.
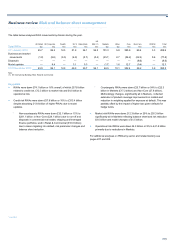
(3) Refers to implementation of a new model or modification of an existing model following approval by the PRA and includes:
o exposure at default treatment (£4.8 billion) in the second quarter of 2013;
o continuation of commercial real estate slotting (£4.4 billion) throughout 2013; and
o loss given default changes to the shipping portfolio (£3.7 billion) in the second half of 2013.
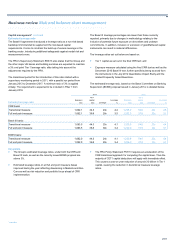
The table below analyses movements in market and operational risk RWAs during the year.
Market risk
Markets Other Total Operational risk Total
£bn £bn £bn £bn £bn
A
t 1 January 2013 36.9 5.7 42.6 45.8 88.4
Business and market movements (9.0) (1.8) (10.8) (4.0) (14.8)
Model updates (1) (1.5) — (1.5) —(1.5)
A
t 31 December 2013 26.4 3.9 30.3 41.8 72.1
Note:
(1) Market risk model updates in 2013 primarily related to valuation adjustments.
*unaudited