RBS 2013 Annual Report Download - page 281
Download and view the complete annual report
Please find page 281 of the 2013 RBS annual report below. You can navigate through the pages in the report by either clicking on the pages listed below, or by using the keyword search tool below to find specific information within the annual report.-
 1
1 -
2
-
3
-
4
-
5
-
6
-
7
-
8
-
9
-
10
-
11
-
12
-
13
-
14
-
15
-
16
-
17
-
18
-
19
-
20
-
21
-
22
-
23
-
24
-
25
-
26
-
27
-
28
-
29
-
30
-
31
-
32
-
33
-
34
-
35
-
36
-
37
-
38
-
39
-
40
-
41
-
42
-
43
-
44
-
45
-
46
-
47
-
48
-
49
-
50
-
51
-
52
-
53
-
54
-
55
-
56
-
57
-
58
-
59
-
60
-
61
-
62
-
63
-
64
-
65
-
66
-
67
-
68
-
69
-
70
-
71
-
72
-
73
-
74
-
75
-
76
-
77
-
78
-
79
-
80
-
81
-
82
-
83
-
84
-
85
-
86
-
87
-
88
-
89
-
90
-
91
-
92
-
93
-
94
-
95
-
96
-
97
-
98
-
99
-
100
-
101
-
102
-
103
-
104
-
105
-
106
-
107
-
108
-
109
-
110
-
111
-
112
-
113
-
114
-
115
-
116
-
117
-
118
-
119
-
120
-
121
-
122
-
123
-
124
-
125
-
126
-
127
-
128
-
129
-
130
-
131
-
132
-
133
-
134
-
135
-
136
-
137
-
138
-
139
-
140
-
141
-
142
-
143
-
144
-
145
-
146
-
147
-
148
-
149
-
150
-
151
-
152
-
153
-
154
-
155
-
156
-
157
-
158
-
159
-
160
-
161
-
162
-
163
-
164
-
165
-
166
-
167
-
168
-
169
-
170
-
171
-
172
-
173
-
174
-
175
-
176
-
177
-
178
-
179
-
180
-
181
-
182
-
183
-
184
-
185
-
186
-
187
-
188
-
189
-
190
-
191
-
192
-
193
-
194
-
195
-
196
-
197
-
198
-
199
-
200
-
201
-
202
-
203
-
204
-
205
-
206
-
207
-
208
-
209
-
210
-
211
-
212
-
213
-
214
-
215
-
216
-
217
-
218
-
219
-
220
-
221
-
222
-
223
-
224
-
225
-
226
-
227
-
228
-
229
-
230
-
231
-
232
-
233
-
234
-
235
-
236
-
237
-
238
-
239
-
240
-
241
-
242
-
243
-
244
-
245
-
246
-
247
-
248
-
249
-
250
-
251
-
252
-
253
-
254
-
255
-
256
-
257
-
258
-
259
-
260
-
261
-
262
-
263
-
264
-
265
-
266
-
267
-
268
-
269
-
270
-
 271
271 -
 272
272 -
 273
273 -
 274
274 -
 275
275 -
 276
276 -
 277
277 -
 278
278 -
 279
279 -
 280
280 -
 281
281 -
 282
282 -
 283
283 -
 284
284 -
 285
285 -
 286
286 -
 287
287 -
 288
288 -
 289
289 -
 290
290 -
 291
291 -
292
-
293
-
294
-
295
-
296
-
297
-
298
-
299
-
300
-
301
-
302
-
303
-
304
-
305
-
306
-
307
-
308
-
309
-
310
-
311
-
312
-
313
-
314
-
315
-
316
-
317
-
318
-
319
-
320
-
321
-
322
-
323
-
324
-
325
-
326
-
327
-
328
-
329
-
330
-
331
-
332
-
333
-
334
-
335
-
336
-
337
-
338
-
339
-
340
-
341
-
342
-
343
-
344
-
345
-
346
-
347
-
348
-
349
-
350
-
351
-
352
-
353
-
354
-
355
-
356
-
357
-
358
-
359
-
360
-
361
-
362
-
363
-
364
-
365
-
366
-
367
-
368
-
369
-
370
-
371
-
372
-
373
-
374
-
375
-
376
-
377
-
378
-
379
-
380
-
381
-
382
-
383
-
384
-
385
-
386
-
387
-
388
-
389
-
390
-
391
-
392
-
393
-
394
-
395
-
396
-
397
-
398
-
399
-
400
-
401
-
402
-
403
-
404
-
405
-
406
-
407
-
408
-
409
-
410
-
411
-
412
-
413
-
414
-
415
-
416
-
417
-
418
-
419
-
420
-
421
-
422
-
423
-
424
-
425
-
426
-
427
-
428
-
429
-
430
-
431
-
432
-
433
-
434
-
435
-
436
-
437
-
438
-
439
-
440
-
441
-
442
-
443
-
444
-
445
-
446
-
447
-
448
-
449
-
450
-
451
-
452
-
453
-
454
-
455
-
456
-
457
-
458
-
459
-
460
-
461
-
462
-
463
-
464
-
465
-
466
-
467
-
468
-
469
-
470
-
471
-
472
-
473
-
474
-
475
-
476
-
477
-
478
-
479
-
480
-
481
-
482
-
483
-
484
-
485
-
486
-
487
-
488
-
489
-
490
-
491
-
492
-
493
-
494
-
495
-
496
-
497
-
498
-
499
-
500
-
501
-
502
-
503
-
504
-
505
-
506
-
507
-
508
-
509
-
510
-
511
-
512
-
513
-
514
-
515
-
516
-
517
-
518
-
519
-
520
-
521
-
522
-
523
-
524
-
525
-
526
-
527
-
528
-
529
-
530
-
531
-
532
-
533
-
534
-
535
-
536
-
537
-
538
-
539
-
540
-
541
-
542
-
543
-
544
-
545
-
546
-
547
-
548
-
549
-
550
-
551
-
552
-
553
-
554
-
555
-
556
-
557
-
558
-
559
-
560
-
561
-
562
-
563
-
564
 |
 |

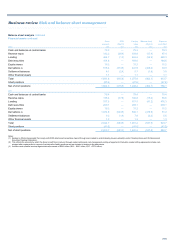
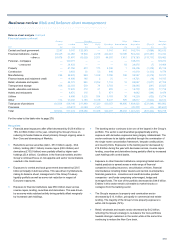
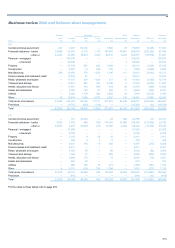
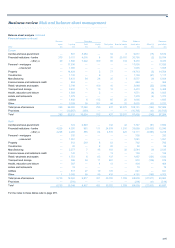
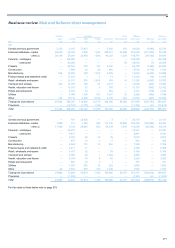
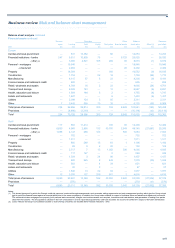
Business review Risk and balance sheet management
279
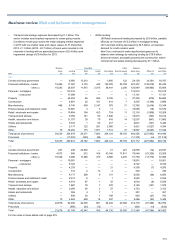
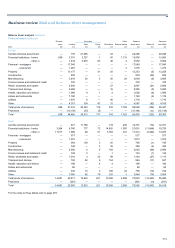
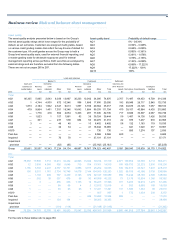
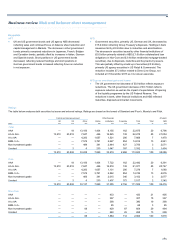
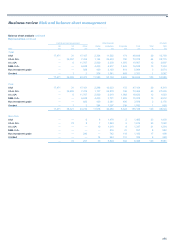
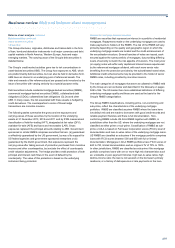
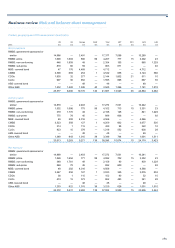
Asset quality
The asset quality analysis presented below is based on the Group’s
internal asset quality ratings which have ranges for the probability of
default, as set out below. Customers are assigned credit grades, based
on various credit grading models that reflect the key drivers of default for
the customer type. All credit grades across the Group map to both a
Group level asset quality scale, used for external financial reporting, and
a master grading scale for wholesale exposures used for internal
management reporting across portfolios. Debt securities are analysed by
external ratings and are therefore excluded from the following tables.
These are set out on pages 285 to 287.
Asset quality band Probability of default range
AQ1 0% - 0.034%
AQ2 0.034% - 0.048%
AQ3 0.048% - 0.095%
AQ4 0.095% - 0.381%
AQ5 0.381% - 1.076%
AQ6 1.076% - 2.153%
AQ7 2.153% - 6.089%
AQ8 6.089% - 17.222%
AQ9 17.222% - 100%
AQ10 100%
Loans and advances
Banks (1) Customers Settlement
Cash and Derivative Derivative balances and
balances at Reverse cash Reverse cash other financial Contingent
central banks repos collateral Other Total repos collateral Other Total assets Derivatives Commitments liabilities Total
2013 £m £m £m £m £m £m £m £m £m £m £m £m £m £m
Total
A
Q1 80,305 5,885 2,043 6,039 13,967 30,233 10,042 34,395 74,670 2,707 71,497 64,453 6,739 314,338
A
Q2 1 4,744 4,930 672 10,346 996 1,899 17,695 20,590 192 69,949 28,717 2,940 132,735
A
Q3 1,873 2,164 1,502 2,347 6,013 1,857 3,796 29,364 35,017 746 94,678 23,126 7,057 168,510
A
Q4 479 9,864 1,451 7,031 18,346 10,642 1,894 99,258 111,794 470 39,157 40,984 4,430 215,660
A
Q5 — 1,776 416 662 2,854 5,403 297 77,045 82,745 717 8,826 33,507 2,087 130,736
A
Q6 — 1,823 1 157 1,981 82 38 39,324 39,444 59 1,487 14,138 1,426 58,535
A
Q7 — 301 — 237 538 684 50 30,279 31,013 22 978 7,437 918 40,906
A
Q8 3 — — 48 48 — 10 8,482 8,492 58 132 1,183 119 10,035
A
Q9 — — — 34 34 — 41 16,944 16,985 —641 1,020 317 18,997
A
Q10 — — — — — — — 730 730 —695 1,274 137 2,836
Past due — — — — — — — 9,068 9,068 620 — — — 9,688
Impaired — — — 70 70 — — 37,101 37,101 — — — — 37,171
Impairment
provision — — — (63) (63) — — (25,162) (25,162) — — — — (25,225)
Group 82,661 26,557 10,343 17,234 54,134 49,897 18,067 374,523 442,487 5,591 288,040 215,839 26,170 1,114,922
2012
Total
A
Q1 78,039 17,806 3,713 10,913 32,432 42,963 15,022 39,734 97,719 2,671 100,652 63,785 8,113 383,411
A
Q2 12 3,556 4,566 526 8,648 710 704 13,101 14,515 185 108,733 20,333 2,810 155,236
A
Q3 1,156 5,703 2,241 2,757 10,701 2,886 3,917 25,252 32,055 539 152,810 23,727 7,431 228,419
A
Q4 100 6,251 1,761 2,734 10,746 14,079 2,144 104,060 120,283 1,202 58,705 40,196 5,736 236,968
A
Q5 — 1,183 469 787 2,439 8,163 679 92,147 100,989 659 13,244 28,165 2,598 148,094
A
Q6 — 282 39 357 678 86 50 40,096 40,232 73 2,175 13,854 1,380 58,392
A
Q7 — 2 — 236 238 1,133 12 36,223 37,368 191 3,205 19,219 1,275 61,496
A
Q8 — — — 68 68 42 12,812 12,818 8 262 5,688 185 19,029
A
Q9 1 — — 93 93 23 7 17,431 17,461 137 1,360 1,363 95 20,510
A
Q10 — — — — — — — 807 807 1 772 1,454 238 3,272
Past due — — — — — — 249 10,285 10,534 999 — — — 11,533
Impaired — — — 134 134 — — 38,365 38,365 — — — — 38,499
Impairment
provision — — — (114) (114) — — (21,148) (21,148) — — — — (21,262)
Group 79,308 34,783 12,789 18,491 66,063 70,047 22,786 409,165 501,998 6,665 441,918 217,784 29,861 1,343,597
For the note to these tables refer to page 283.