RBS 2013 Annual Report Download - page 372
Download and view the complete annual report
Please find page 372 of the 2013 RBS annual report below. You can navigate through the pages in the report by either clicking on the pages listed below, or by using the keyword search tool below to find specific information within the annual report.-
 1
1 -
2
-
3
-
4
-
5
-
6
-
7
-
8
-
9
-
10
-
11
-
12
-
13
-
14
-
15
-
16
-
17
-
18
-
19
-
20
-
21
-
22
-
23
-
24
-
25
-
26
-
27
-
28
-
29
-
30
-
31
-
32
-
33
-
34
-
35
-
36
-
37
-
38
-
39
-
40
-
41
-
42
-
43
-
44
-
45
-
46
-
47
-
48
-
49
-
50
-
51
-
52
-
53
-
54
-
55
-
56
-
57
-
58
-
59
-
60
-
61
-
62
-
63
-
64
-
65
-
66
-
67
-
68
-
69
-
70
-
71
-
72
-
73
-
74
-
75
-
76
-
77
-
78
-
79
-
80
-
81
-
82
-
83
-
84
-
85
-
86
-
87
-
88
-
89
-
90
-
91
-
92
-
93
-
94
-
95
-
96
-
97
-
98
-
99
-
100
-
101
-
102
-
103
-
104
-
105
-
106
-
107
-
108
-
109
-
110
-
111
-
112
-
113
-
114
-
115
-
116
-
117
-
118
-
119
-
120
-
121
-
122
-
123
-
124
-
125
-
126
-
127
-
128
-
129
-
130
-
131
-
132
-
133
-
134
-
135
-
136
-
137
-
138
-
139
-
140
-
141
-
142
-
143
-
144
-
145
-
146
-
147
-
148
-
149
-
150
-
151
-
152
-
153
-
154
-
155
-
156
-
157
-
158
-
159
-
160
-
161
-
162
-
163
-
164
-
165
-
166
-
167
-
168
-
169
-
170
-
171
-
172
-
173
-
174
-
175
-
176
-
177
-
178
-
179
-
180
-
181
-
182
-
183
-
184
-
185
-
186
-
187
-
188
-
189
-
190
-
191
-
192
-
193
-
194
-
195
-
196
-
197
-
198
-
199
-
200
-
201
-
202
-
203
-
204
-
205
-
206
-
207
-
208
-
209
-
210
-
211
-
212
-
213
-
214
-
215
-
216
-
217
-
218
-
219
-
220
-
221
-
222
-
223
-
224
-
225
-
226
-
227
-
228
-
229
-
230
-
231
-
232
-
233
-
234
-
235
-
236
-
237
-
238
-
239
-
240
-
241
-
242
-
243
-
244
-
245
-
246
-
247
-
248
-
249
-
250
-
251
-
252
-
253
-
254
-
255
-
256
-
257
-
258
-
259
-
260
-
261
-
262
-
263
-
264
-
265
-
266
-
267
-
268
-
269
-
270
-
271
-
272
-
273
-
274
-
275
-
276
-
277
-
278
-
279
-
280
-
281
-
282
-
283
-
284
-
285
-
286
-
287
-
288
-
289
-
290
-
291
-
292
-
293
-
294
-
295
-
296
-
297
-
298
-
299
-
300
-
301
-
302
-
303
-
304
-
305
-
306
-
307
-
308
-
309
-
310
-
311
-
312
-
313
-
314
-
315
-
316
-
317
-
318
-
319
-
320
-
321
-
322
-
323
-
324
-
325
-
326
-
327
-
328
-
329
-
330
-
331
-
332
-
333
-
334
-
335
-
336
-
337
-
338
-
339
-
340
-
341
-
342
-
343
-
344
-
345
-
346
-
347
-
348
-
349
-
350
-
351
-
352
-
353
-
354
-
355
-
356
-
357
-
358
-
359
-
360
-
361
-
 362
362 -
 363
363 -
 364
364 -
 365
365 -
 366
366 -
 367
367 -
 368
368 -
 369
369 -
 370
370 -
 371
371 -
 372
372 -
 373
373 -
 374
374 -
 375
375 -
 376
376 -
 377
377 -
 378
378 -
 379
379 -
 380
380 -
 381
381 -
 382
382 -
383
-
384
-
385
-
386
-
387
-
388
-
389
-
390
-
391
-
392
-
393
-
394
-
395
-
396
-
397
-
398
-
399
-
400
-
401
-
402
-
403
-
404
-
405
-
406
-
407
-
408
-
409
-
410
-
411
-
412
-
413
-
414
-
415
-
416
-
417
-
418
-
419
-
420
-
421
-
422
-
423
-
424
-
425
-
426
-
427
-
428
-
429
-
430
-
431
-
432
-
433
-
434
-
435
-
436
-
437
-
438
-
439
-
440
-
441
-
442
-
443
-
444
-
445
-
446
-
447
-
448
-
449
-
450
-
451
-
452
-
453
-
454
-
455
-
456
-
457
-
458
-
459
-
460
-
461
-
462
-
463
-
464
-
465
-
466
-
467
-
468
-
469
-
470
-
471
-
472
-
473
-
474
-
475
-
476
-
477
-
478
-
479
-
480
-
481
-
482
-
483
-
484
-
485
-
486
-
487
-
488
-
489
-
490
-
491
-
492
-
493
-
494
-
495
-
496
-
497
-
498
-
499
-
500
-
501
-
502
-
503
-
504
-
505
-
506
-
507
-
508
-
509
-
510
-
511
-
512
-
513
-
514
-
515
-
516
-
517
-
518
-
519
-
520
-
521
-
522
-
523
-
524
-
525
-
526
-
527
-
528
-
529
-
530
-
531
-
532
-
533
-
534
-
535
-
536
-
537
-
538
-
539
-
540
-
541
-
542
-
543
-
544
-
545
-
546
-
547
-
548
-
549
-
550
-
551
-
552
-
553
-
554
-
555
-
556
-
557
-
558
-
559
-
560
-
561
-
562
-
563
-
564
 |
 |

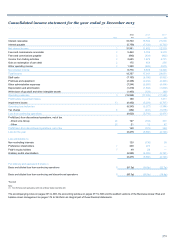
Consolidated income statement for the year ended 31 December 2013
370
2013 2012* 2011*
Note £m £m £m
Interest receivable 16,740 18,530 21,036
Interest payable (5,759) (7,128) (8,733)
Net interest income 110,981 11,402 12,303
Fees and commissions receivable 2 5,460 5,709 6,379
Fees and commissions payable 2 (942) (834) (962)
Income from trading activities 2 2,685 1,675 2,701
Gain on redemption of own debt 2 175 454 255
Other operating income 2 1,398 (465) 3,975
Non-interest income 8,776 6,539 12,348
Total income 19,757 17,941 24,651
Staff costs (7,163) (8,188) (8,562)
Premises and equipment (2,348) (2,232) (2,423)
Other administrative expenses (7,244) (5,593) (4,436)
Depreciation and amortisation (1,410) (1,802) (1,839)
Write-down of goodwill and other intangible assets (1,403) (124) (80)
Operating expenses 3(19,568) (17,939) (17,340)
Profit before impairment losses 189 2 7,311
Impairment losses 13 (8,432) (5,279) (8,707)
Operating loss before tax (8,243) (5,277) (1,396)
Tax charge 6 (382) (441) (1,075)
Loss from continuing operations (8,625) (5,718) (2,471)
Profit/(loss) from discontinued operations, net of tax
- Direct Line Group 20 127 (184) 301
- Other 20 21 12 47
Profit/(loss) from discontinued operations, net of tax 148 (172) 348
Loss for the year (8,477) (5,890) (2,123)
Loss attributable to:
Non-controlling interests 120 (136) 28
Preference shareholders 7 349 273 —
Paid-in equity holders 7 49 28 —
Ordinary and B shareholders (8,995) (6,055) (2,151)
(8,477) (5,890) (2,123)
Per ordinary and equivalent B share (1)
Basic and diluted loss from continuing operations 9 (81.3p) (54.5p) (22.7p)
Basic and diluted loss from continuing and discontinued operations 9 (80.3p) (55.0p) (19.9p)
*Restated
Note:
(1) Ten B shares rank pari-passu with one ordinary share (see Note 26).
The accompanying notes on pages 391 to 496, the accounting policies on pages 377 to 389 and the audited sections of the Business review: Risk and
balance sheet management on pages 174 to 364 form an integral part of these financial statements.