RBS 2013 Annual Report Download - page 187
Download and view the complete annual report
Please find page 187 of the 2013 RBS annual report below. You can navigate through the pages in the report by either clicking on the pages listed below, or by using the keyword search tool below to find specific information within the annual report.-
 1
1 -
2
-
3
-
4
-
5
-
6
-
7
-
8
-
9
-
10
-
11
-
12
-
13
-
14
-
15
-
16
-
17
-
18
-
19
-
20
-
21
-
22
-
23
-
24
-
25
-
26
-
27
-
28
-
29
-
30
-
31
-
32
-
33
-
34
-
35
-
36
-
37
-
38
-
39
-
40
-
41
-
42
-
43
-
44
-
45
-
46
-
47
-
48
-
49
-
50
-
51
-
52
-
53
-
54
-
55
-
56
-
57
-
58
-
59
-
60
-
61
-
62
-
63
-
64
-
65
-
66
-
67
-
68
-
69
-
70
-
71
-
72
-
73
-
74
-
75
-
76
-
77
-
78
-
79
-
80
-
81
-
82
-
83
-
84
-
85
-
86
-
87
-
88
-
89
-
90
-
91
-
92
-
93
-
94
-
95
-
96
-
97
-
98
-
99
-
100
-
101
-
102
-
103
-
104
-
105
-
106
-
107
-
108
-
109
-
110
-
111
-
112
-
113
-
114
-
115
-
116
-
117
-
118
-
119
-
120
-
121
-
122
-
123
-
124
-
125
-
126
-
127
-
128
-
129
-
130
-
131
-
132
-
133
-
134
-
135
-
136
-
137
-
138
-
139
-
140
-
141
-
142
-
143
-
144
-
145
-
146
-
147
-
148
-
149
-
150
-
151
-
152
-
153
-
154
-
155
-
156
-
157
-
158
-
159
-
160
-
161
-
162
-
163
-
164
-
165
-
166
-
167
-
168
-
169
-
170
-
171
-
172
-
173
-
174
-
175
-
176
-
 177
177 -
 178
178 -
 179
179 -
 180
180 -
 181
181 -
 182
182 -
 183
183 -
 184
184 -
 185
185 -
 186
186 -
 187
187 -
 188
188 -
 189
189 -
 190
190 -
 191
191 -
 192
192 -
 193
193 -
 194
194 -
 195
195 -
 196
196 -
 197
197 -
198
-
199
-
200
-
201
-
202
-
203
-
204
-
205
-
206
-
207
-
208
-
209
-
210
-
211
-
212
-
213
-
214
-
215
-
216
-
217
-
218
-
219
-
220
-
221
-
222
-
223
-
224
-
225
-
226
-
227
-
228
-
229
-
230
-
231
-
232
-
233
-
234
-
235
-
236
-
237
-
238
-
239
-
240
-
241
-
242
-
243
-
244
-
245
-
246
-
247
-
248
-
249
-
250
-
251
-
252
-
253
-
254
-
255
-
256
-
257
-
258
-
259
-
260
-
261
-
262
-
263
-
264
-
265
-
266
-
267
-
268
-
269
-
270
-
271
-
272
-
273
-
274
-
275
-
276
-
277
-
278
-
279
-
280
-
281
-
282
-
283
-
284
-
285
-
286
-
287
-
288
-
289
-
290
-
291
-
292
-
293
-
294
-
295
-
296
-
297
-
298
-
299
-
300
-
301
-
302
-
303
-
304
-
305
-
306
-
307
-
308
-
309
-
310
-
311
-
312
-
313
-
314
-
315
-
316
-
317
-
318
-
319
-
320
-
321
-
322
-
323
-
324
-
325
-
326
-
327
-
328
-
329
-
330
-
331
-
332
-
333
-
334
-
335
-
336
-
337
-
338
-
339
-
340
-
341
-
342
-
343
-
344
-
345
-
346
-
347
-
348
-
349
-
350
-
351
-
352
-
353
-
354
-
355
-
356
-
357
-
358
-
359
-
360
-
361
-
362
-
363
-
364
-
365
-
366
-
367
-
368
-
369
-
370
-
371
-
372
-
373
-
374
-
375
-
376
-
377
-
378
-
379
-
380
-
381
-
382
-
383
-
384
-
385
-
386
-
387
-
388
-
389
-
390
-
391
-
392
-
393
-
394
-
395
-
396
-
397
-
398
-
399
-
400
-
401
-
402
-
403
-
404
-
405
-
406
-
407
-
408
-
409
-
410
-
411
-
412
-
413
-
414
-
415
-
416
-
417
-
418
-
419
-
420
-
421
-
422
-
423
-
424
-
425
-
426
-
427
-
428
-
429
-
430
-
431
-
432
-
433
-
434
-
435
-
436
-
437
-
438
-
439
-
440
-
441
-
442
-
443
-
444
-
445
-
446
-
447
-
448
-
449
-
450
-
451
-
452
-
453
-
454
-
455
-
456
-
457
-
458
-
459
-
460
-
461
-
462
-
463
-
464
-
465
-
466
-
467
-
468
-
469
-
470
-
471
-
472
-
473
-
474
-
475
-
476
-
477
-
478
-
479
-
480
-
481
-
482
-
483
-
484
-
485
-
486
-
487
-
488
-
489
-
490
-
491
-
492
-
493
-
494
-
495
-
496
-
497
-
498
-
499
-
500
-
501
-
502
-
503
-
504
-
505
-
506
-
507
-
508
-
509
-
510
-
511
-
512
-
513
-
514
-
515
-
516
-
517
-
518
-
519
-
520
-
521
-
522
-
523
-
524
-
525
-
526
-
527
-
528
-
529
-
530
-
531
-
532
-
533
-
534
-
535
-
536
-
537
-
538
-
539
-
540
-
541
-
542
-
543
-
544
-
545
-
546
-
547
-
548
-
549
-
550
-
551
-
552
-
553
-
554
-
555
-
556
-
557
-
558
-
559
-
560
-
561
-
562
-
563
-
564
 |
 |

Business review Risk and balance sheet management
185
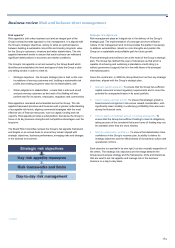
Risk appetite measures
Risk appetite starts with the strategic goals and risk philosophy set by the
Group Board and is cascaded through key targets, limits and risk
tolerances that influence decision making, from the enterprise-wide to the
transactional level.
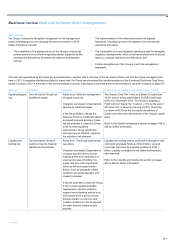
The risk appetite framework is based on four main pillars:
• Risk envelope metrics - The Group has set sustainable business
goals over a medium-term horizon, including a target for the capital
ratio, leverage ratio, loan:deposit ratio, liquidity portfolio and use of
wholesale funding. These are the broad boundaries within which the
Group operates. Non-Core division also acts as a primary driver for
reducing risk and the size of the balance sheet.
• Quantitative risk appetite targets - Risk appetite is also aligned with
potential risk exposures and vulnerabilities under severe but
plausible stress conditions. Quantitative targets, to be met under
stress conditions, are set around the Group’s strategic risk
objectives for maintaining capital adequacy, delivering stable
earnings growth and ensuring stable and efficient access to funding
and liquidity.
• Qualitative risk appetite targets - The fourth strategic risk objective
of maintaining stakeholder confidence covers qualitative aspects
relating to the culture of risk management and controls and meeting
stakeholder expectations. Risk appetite is based around identified
expectations across a range of stakeholders (e.g. customers,
employees, investors and the general public) and is closely aligned
with key risk policies and controls (e.g. the Group Policy Framework,
conduct risk and reputational risk).
• Risk control frameworks and limits - Risk control frameworks set
detailed tolerances and limits for material risk types (e.g. credit risk,
market risk, conduct risk and operational risk) that are used to
manage risk on a day-to-day basis. These limits support and are
required to be consistent with the high-level risk appetite targets.
The framework is supported by a programme of communication,
engagement and training rolled out across the Group to embed a wide
understanding of the purpose and value of an effective risk appetite.
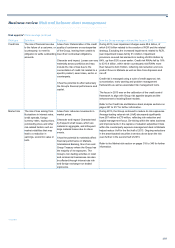
Risk appetite supports value creation in a safe sustainable way. It is
embedded within the annual planning and budgeting process. Business
strategies are designed on the basis of key value drivers (e.g. customer
franchises, income and profit generation, synergies) and whether they fit
within agreed risk appetite boundaries. A range of different but
complementary tools have been developed to measure whether strategic
plans are consistent with risk appetite, to test broader ‘what if’ questions
and to assess the impact of changes in key assumptions:
• Integrated stress testing - assesses how earnings, capital and
funding positions change under an unfavourable, yet plausible,
scenario. Stress scenarios can differ by theme, geographical
location or severity.
*unaudited
• Economic capital - provides complementary insights, with a breadth
of understanding of risk profile changes and ‘tail risks’ generated by
stimulating millions of different scenarios.
• Sensitivity analysis - provides ‘ready reckoners’ around changes in
key variables. It provides a high-level view on questions such as
‘what if gross domestic product worsened by a further 1%’,
identifying certain tipping points where the Group’s risk profile
moves outside appetite.
More effective processes for reporting the results have also been
developed, presenting the Board and senior management with a more
holistic and dynamic view of key risk exposures.
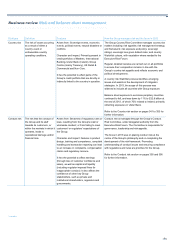
Divisional risk appetite statements
Risk appetite is set at the Group level then cascaded and embedded
across all business areas. Each division is required to develop, own and
manage a risk appetite statement aligned with the Group’s risk appetite
and:
• Covers all identified material risks;
• Enables each business to understand its acceptable levels of risk;
and
• Ensures that commercial strategies are aligned with the use of
available financial resources.
By setting a clear risk appetite and embedding a strong risk culture
throughout its businesses, the Group can identify, measure and control
risk exposures and respond effectively to shocks. Each division is
responsible for ensuring its strategic plans are consistent with its
approved risk appetite.
Risk control frameworks and limits
Risk control frameworks and their associated limits are an integral part of
the risk appetite framework and a key part of embedding risk appetite
targets in day-to-day risk management decisions. The risk control
frameworks manage risk concentrations on a ‘bottom-up’ basis through
portfolio and product limit setting, expressing a clear tolerance for
material risk types that is aligned to business activities. These are aligned
with a ‘top-down’ approach via a calibration of their aggregate
contribution with the Group’s risk appetite targets (i.e. earnings volatility,
capital and liquidity consumption and impact on stakeholder confidence).
The Group Policy Framework directly supports the qualitative aspects of
risk appetite, helping to rebuild and maintain stakeholder confidence in
the Group’s risk control and governance. Its integrated approach is
designed to ensure that an appropriate standard of control is set for each
of the material risks the Group faces, with an effective assurance process
put in place to monitor and report on performance. Risk appetite has its
own policy standard within the Group Policy Framework that sets out
clear roles and responsibilities to measure, cascade and report
performance against risk appetite, as well as to provide assurances that
business is being conducted within approved risk limits and tolerances.