RBS 2013 Annual Report Download - page 505
Download and view the complete annual report
Please find page 505 of the 2013 RBS annual report below. You can navigate through the pages in the report by either clicking on the pages listed below, or by using the keyword search tool below to find specific information within the annual report.-
 1
1 -
2
-
3
-
4
-
5
-
6
-
7
-
8
-
9
-
10
-
11
-
12
-
13
-
14
-
15
-
16
-
17
-
18
-
19
-
20
-
21
-
22
-
23
-
24
-
25
-
26
-
27
-
28
-
29
-
30
-
31
-
32
-
33
-
34
-
35
-
36
-
37
-
38
-
39
-
40
-
41
-
42
-
43
-
44
-
45
-
46
-
47
-
48
-
49
-
50
-
51
-
52
-
53
-
54
-
55
-
56
-
57
-
58
-
59
-
60
-
61
-
62
-
63
-
64
-
65
-
66
-
67
-
68
-
69
-
70
-
71
-
72
-
73
-
74
-
75
-
76
-
77
-
78
-
79
-
80
-
81
-
82
-
83
-
84
-
85
-
86
-
87
-
88
-
89
-
90
-
91
-
92
-
93
-
94
-
95
-
96
-
97
-
98
-
99
-
100
-
101
-
102
-
103
-
104
-
105
-
106
-
107
-
108
-
109
-
110
-
111
-
112
-
113
-
114
-
115
-
116
-
117
-
118
-
119
-
120
-
121
-
122
-
123
-
124
-
125
-
126
-
127
-
128
-
129
-
130
-
131
-
132
-
133
-
134
-
135
-
136
-
137
-
138
-
139
-
140
-
141
-
142
-
143
-
144
-
145
-
146
-
147
-
148
-
149
-
150
-
151
-
152
-
153
-
154
-
155
-
156
-
157
-
158
-
159
-
160
-
161
-
162
-
163
-
164
-
165
-
166
-
167
-
168
-
169
-
170
-
171
-
172
-
173
-
174
-
175
-
176
-
177
-
178
-
179
-
180
-
181
-
182
-
183
-
184
-
185
-
186
-
187
-
188
-
189
-
190
-
191
-
192
-
193
-
194
-
195
-
196
-
197
-
198
-
199
-
200
-
201
-
202
-
203
-
204
-
205
-
206
-
207
-
208
-
209
-
210
-
211
-
212
-
213
-
214
-
215
-
216
-
217
-
218
-
219
-
220
-
221
-
222
-
223
-
224
-
225
-
226
-
227
-
228
-
229
-
230
-
231
-
232
-
233
-
234
-
235
-
236
-
237
-
238
-
239
-
240
-
241
-
242
-
243
-
244
-
245
-
246
-
247
-
248
-
249
-
250
-
251
-
252
-
253
-
254
-
255
-
256
-
257
-
258
-
259
-
260
-
261
-
262
-
263
-
264
-
265
-
266
-
267
-
268
-
269
-
270
-
271
-
272
-
273
-
274
-
275
-
276
-
277
-
278
-
279
-
280
-
281
-
282
-
283
-
284
-
285
-
286
-
287
-
288
-
289
-
290
-
291
-
292
-
293
-
294
-
295
-
296
-
297
-
298
-
299
-
300
-
301
-
302
-
303
-
304
-
305
-
306
-
307
-
308
-
309
-
310
-
311
-
312
-
313
-
314
-
315
-
316
-
317
-
318
-
319
-
320
-
321
-
322
-
323
-
324
-
325
-
326
-
327
-
328
-
329
-
330
-
331
-
332
-
333
-
334
-
335
-
336
-
337
-
338
-
339
-
340
-
341
-
342
-
343
-
344
-
345
-
346
-
347
-
348
-
349
-
350
-
351
-
352
-
353
-
354
-
355
-
356
-
357
-
358
-
359
-
360
-
361
-
362
-
363
-
364
-
365
-
366
-
367
-
368
-
369
-
370
-
371
-
372
-
373
-
374
-
375
-
376
-
377
-
378
-
379
-
380
-
381
-
382
-
383
-
384
-
385
-
386
-
387
-
388
-
389
-
390
-
391
-
392
-
393
-
394
-
395
-
396
-
397
-
398
-
399
-
400
-
401
-
402
-
403
-
404
-
405
-
406
-
407
-
408
-
409
-
410
-
411
-
412
-
413
-
414
-
415
-
416
-
417
-
418
-
419
-
420
-
421
-
422
-
423
-
424
-
425
-
426
-
427
-
428
-
429
-
430
-
431
-
432
-
433
-
434
-
435
-
436
-
437
-
438
-
439
-
440
-
441
-
442
-
443
-
444
-
445
-
446
-
447
-
448
-
449
-
450
-
451
-
452
-
453
-
454
-
455
-
456
-
457
-
458
-
459
-
460
-
461
-
462
-
463
-
464
-
465
-
466
-
467
-
468
-
469
-
470
-
471
-
472
-
473
-
474
-
475
-
476
-
477
-
478
-
479
-
480
-
481
-
482
-
483
-
484
-
485
-
486
-
487
-
488
-
489
-
490
-
491
-
492
-
493
-
494
-
 495
495 -
 496
496 -
 497
497 -
 498
498 -
 499
499 -
 500
500 -
 501
501 -
 502
502 -
 503
503 -
 504
504 -
 505
505 -
 506
506 -
 507
507 -
 508
508 -
 509
509 -
 510
510 -
 511
511 -
 512
512 -
 513
513 -
 514
514 -
 515
515 -
516
-
517
-
518
-
519
-
520
-
521
-
522
-
523
-
524
-
525
-
526
-
527
-
528
-
529
-
530
-
531
-
532
-
533
-
534
-
535
-
536
-
537
-
538
-
539
-
540
-
541
-
542
-
543
-
544
-
545
-
546
-
547
-
548
-
549
-
550
-
551
-
552
-
553
-
554
-
555
-
556
-
557
-
558
-
559
-
560
-
561
-
562
-
563
-
564
 |
 |

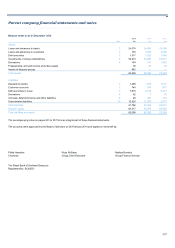
Parent company financial statements and notes
503
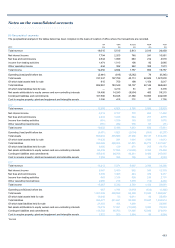
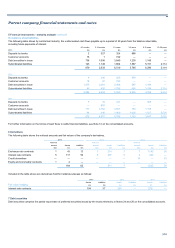
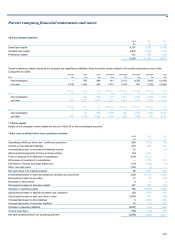
4 Financial instruments – valuation
Fair value of financial instruments not carried at fair value
The following table shows the carrying value and fair value of financial instruments carried at amortised cost on the balance sheet.
2013 2012 2011
Carrying value Fair value (1) Carrying value Fair value Carrying value Fair value
£bn £bn £bn £bn £bn £bn
Financial assets
Loans and advances to banks 24.6 24.9 24.1 24.8 18.4 18.4
Loans and advances to customers 0.2 0.2 1.3 1.3 4.1 4.1
Debt securities 1.5 2.5 1.5 2.0 1.6 1.5
Financial liabilities
Deposits by banks 1.5 1.6 1.5 1.5 1.1 1.1
Customer accounts 0.7 0.7 0.8 0.8 1.0 1.0
Debt securities in issue 6.9 6.9 9.2 8.9 8.4 7.9
Subordinated liabilities 12.4 12.5 11.3 10.3 8.8 5.6
Note:
(1) Fair values determined using techniques based on level 2 inputs.
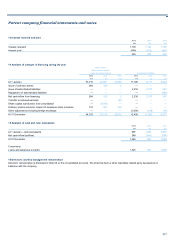
5 Financial instruments - maturity analysis
Remaining maturity
The following table shows the residual maturity of financial instruments, based on contractual date of maturity.
2013 2012 2011
Less than More than Less than More than Less than More than
12 months 12 months Total 12 months 12 months Total 12 months 12 months Total
£m £m £m £m £m £m £m £m £m
A
ssets
Loans and advances to banks 4,730 19,844 24,574 6,382 17,684 24,066 2,694 15,674 18,368
Loans and advances to customers 150 3 153 — 1,266 1,266 1,341 2,715 4,056
Debt securities 26 1,491 1,517 26 1,496 1,522 65 1,503 1,568
Derivatives 33 131 164 296 215 511 918 584 1,502
Liabilities
Deposits by banks — 1,490 1,490 320 1,135 1,455 9 1,082 1,091
Customer accounts 14 726 740 838 — 838 977 — 977
Debt securities in issue 1,643 5,372 7,015 5,506 3,804 9,310 3,800 4,573 8,373
Derivatives 10 52 62 — 7 7 25 54 79
Subordinated liabilities 699 11,727 12,426 647 10,658 11,305 121 8,656 8,777